Research
Oct 15, 2025
Mapping the Stablecoin Economy: Scale, Users, and Yield
Introduction
Stablecoins are experiencing a stratospheric rise, capturing attention across the financial ecosystem as they increasingly serve as a bridge between traditional finance and the digital asset economy. Their appeal lies not only in the ease of transacting but also in the perception of “risk-free” yield opportunities that they appear to offer. This report explores the stablecoin landscape, providing context on the rapid adoption of stablecoins, exploring the mechanics and risks behind yield-bearing solutions, and aims to highlight the implications for investors, and institutions alike.
The Landscape: Market Size and Players
Stablecoins have emerged as the backbone of digital asset markets, facilitating over $264 trillion in on-chain settlement since 2019. Beneath this headline figure lies a heterogeneous mix of activity, ranging from high-frequency micro-flows to large institutional wallet movements, which complicates assessments of “real” economic usage. Within this structure, USDT remains the dominant instrument.
On Ethereum, its activity is concentrated in $1M+ transfers, underscoring its role as institutional-grade plumbing for liquidity provision and settlement. By contrast, on Tron, flows are more evenly distributed across mid- and small-size brackets, consistent with peer-to-peer adoption in emerging markets. Taken together, these dynamics evidence the dual function of stablecoins: infrastructure enabling institutional capital flows, and a transactional lifeline providing dollar access for everyone.
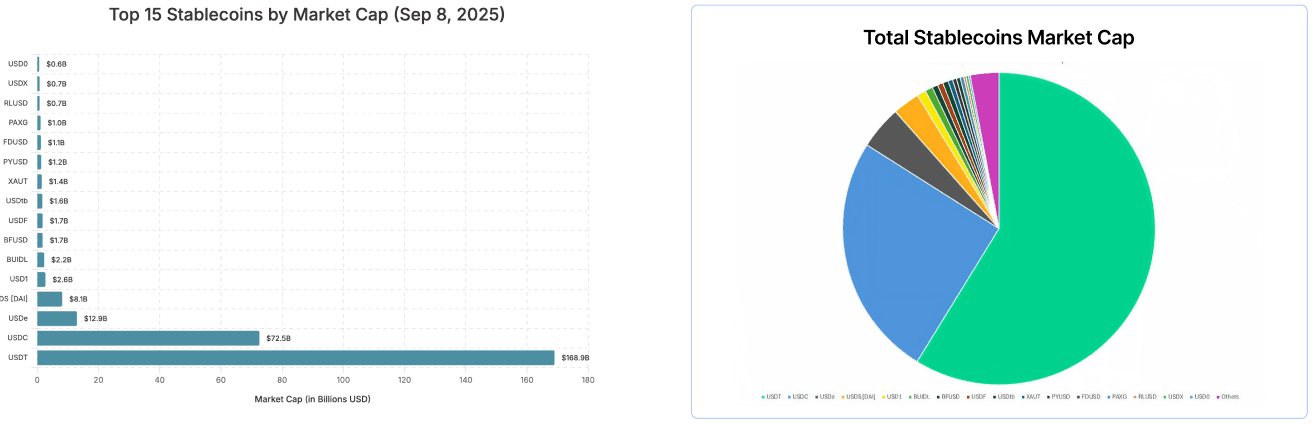
Stablecoin Market Cap Exceeds $250 Billion
Stablecoin circulation has expanded dramatically over the past year. According to DeFiLlama, the total stablecoin market capitalisation rose from $170.3 billion in September 2024 to $287.3 billion in September 2025, marking a 68.7% increase. This growth remains highly concentrated among a few dominant issuers. Tether (USDT) alone accounts for nearly 60% of circulating supply, while together with USD Coin (USDC), the two control approximately 84.3% of the market. This concentration shows both the resilience of leading issuers and the limited competitive penetration of alternative stablecoins.
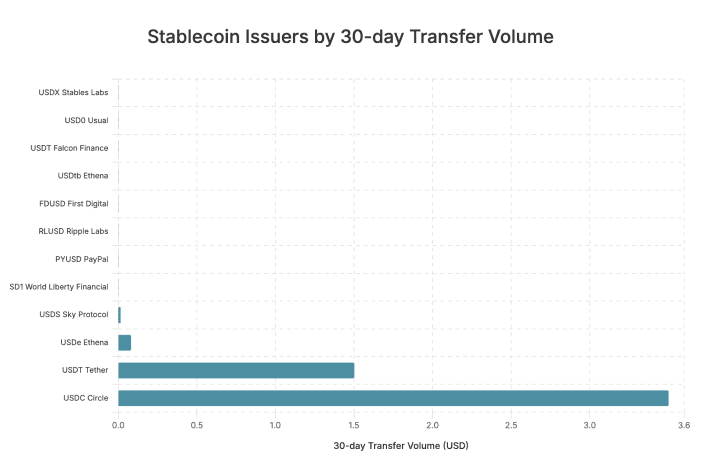
30-Day Transfer Volume Over $5.5 Trillion
Whilst Tether leads in market capitalisation, Circle’s USDC has emerged as the volume leader.
Total activity remains dominated by the two major players, with USDT averaging over $1 trillion in monthly transaction volume between June 2024 and June 2025, peaking at $1.14 trillion in January 2025. Over the same period, USDC processed between $1.24 trillion and $3.29 trillion per month, outpacing Tether in transactional usage.
At the same time, smaller stablecoins are scaling rapidly, albeit from a lower base. EURC recorded an average 89% month-on-month increase, climbing from $47 million in June 2024 to $7.5 billion in June 2025. Similarly, PayPal’s PYUSD expanded from $783 million to $3.95 billion in monthly volume.
These trends suggest a dual-track market structure: entrenched dominance by USDT and USDC on one side, and rapid growth among niche or specialised stablecoins on the other.
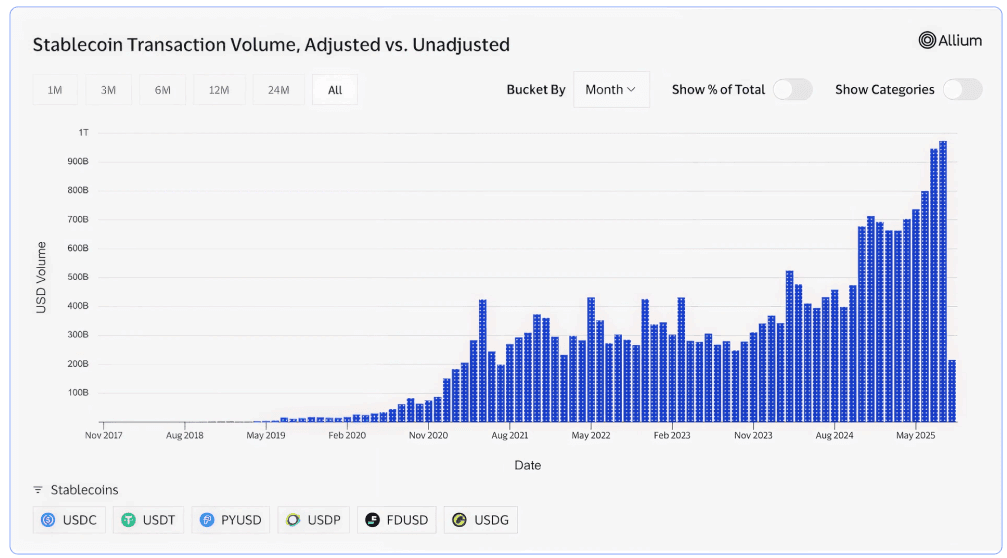
Adjusted Transfer Volume
Visa’s on-chain Analytics Dashboard (powered by Allium data feeds) estimates cumulative stablecoin transfer volume at $264.4 trillion since 2019. Yet this figure aggregates all on-chain flows, including high-frequency bot activity, intra-exchange transfers, redundant contract interactions, and large-scale institutional wallet movements.
To address this, Visa applies an adjustment methodology that excludes either wallets executing more than 1,000 transactions or wallets with more than $10 million in transfers over a rolling 30-day period, unless the wallet is a known exchange, DEX, ramp, or lending protocol. This filter refocuses the lens on retail-oriented activity such as trading, payments, lending, and on/off-ramp usage. Under this adjusted framework, stablecoin volume falls to $23.5 trillion.
The implication is clear: roughly 90% of observed stablecoin activity is attributable to non-retail participants, showcasing the dominance of institutional flows, market makers, and automated trading systems in driving stablecoin settlement.
While headline stablecoin volumes highlight the scale of adoption, they also overstate the degree of “real economy” usage.
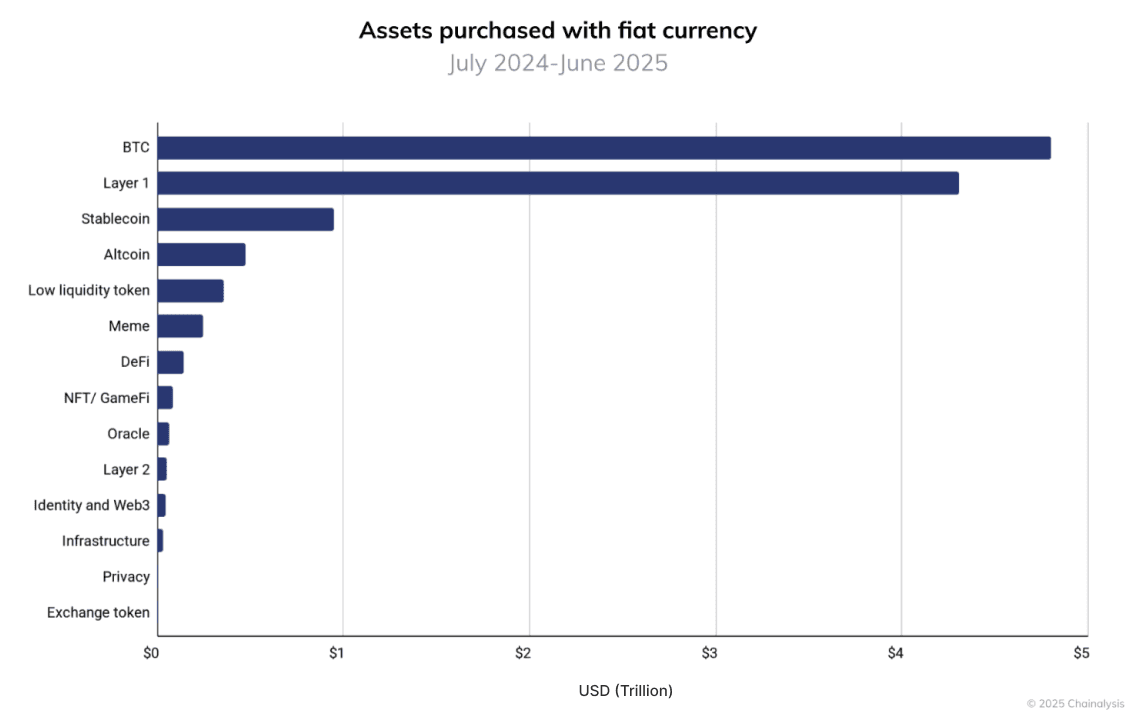
Do Stablecoins Onboard New Users?
While stablecoins are rapidly gaining adoption, they remain the third-largest category of assets purchased directly with fiat. Bitcoin continues to dominate as the primary gateway into the industry, with over $4.6 trillion in fiat inflows, more than double any other category. The next-largest segment, Layer 1 tokens (excluding BTC and ETH), attracted approximately $4.3 trillion between July 2024 and July 2025.
Stablecoins ranked third, with under $1 trillion in fiat inflows, highlighting their growing relevance but also underscoring the lead maintained by Bitcoin and Layer 1 networks in capital onboarding. Beyond these, altcoins drew in about $500 billion, while lower-liquidity categories such as meme coins, DeFi tokens, and niche assets each accounted for less than $300 billion.
USDT DEEP DIVE
Institutions Lead USDT Volume on ETH
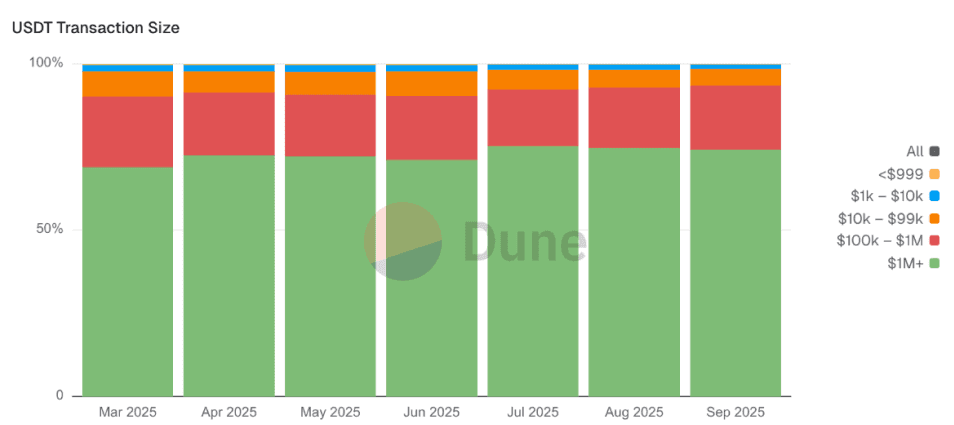
To explore the institutional footprint of USDT, we conducted in-house analysis of average transaction sizes and activity distribution across categories on Ethereum.
The results for transaction size (shown below) tell us that USDT activity is overwhelmingly concentrated in large transfers exceeding $1 million, reinforcing Visa’s research and proving its role in institutional flows, liquidity provisioning, and high-value settlement.
By contrast, retail-sized transfers below $10,000 account for only a marginal share, underscoring that USDT on Ethereum functions less as a payment instrument and more as market infrastructure. Mid-tier transactions between $10,000 and $1 million remain steady but are materially outweighed by the dominance of large-scale transfers.
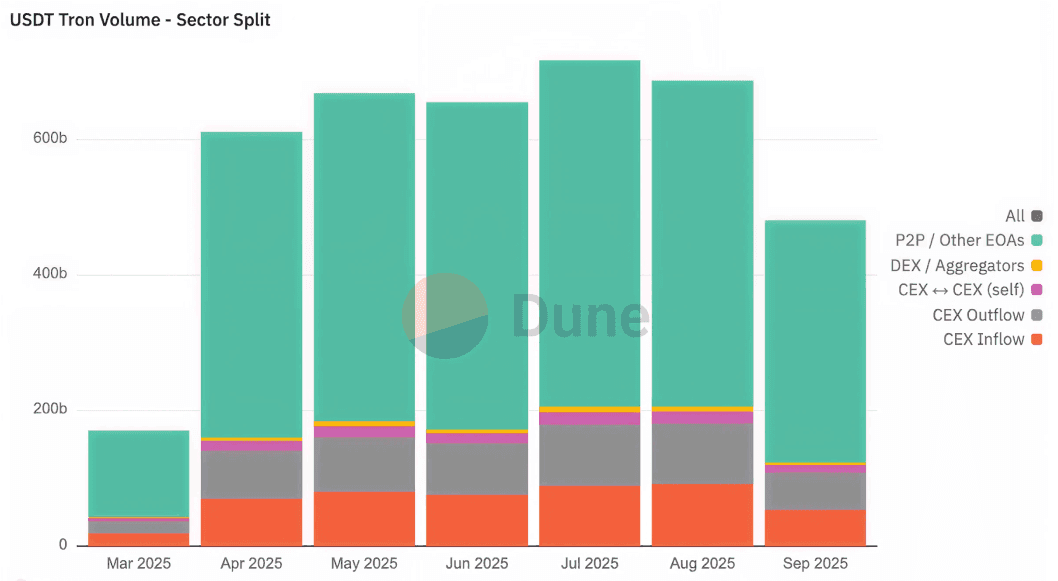
Externally Owned Accounts Lead USDT Volume
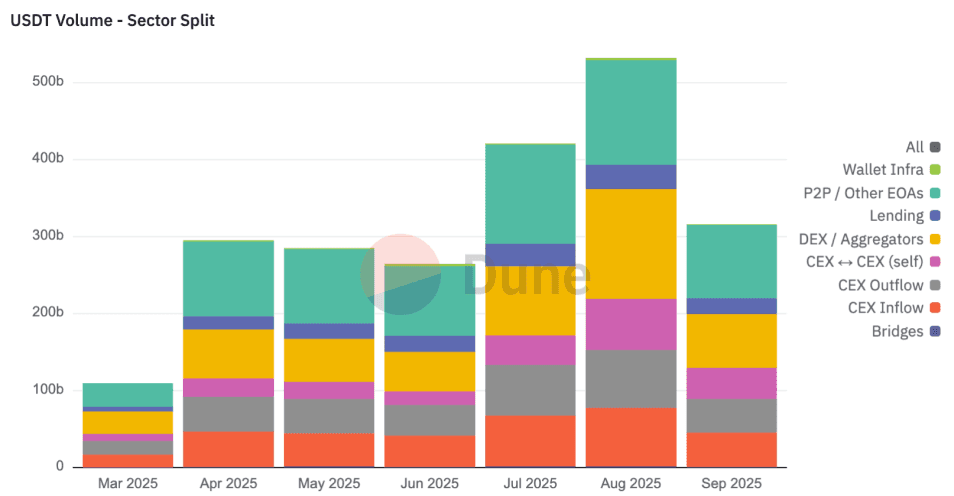
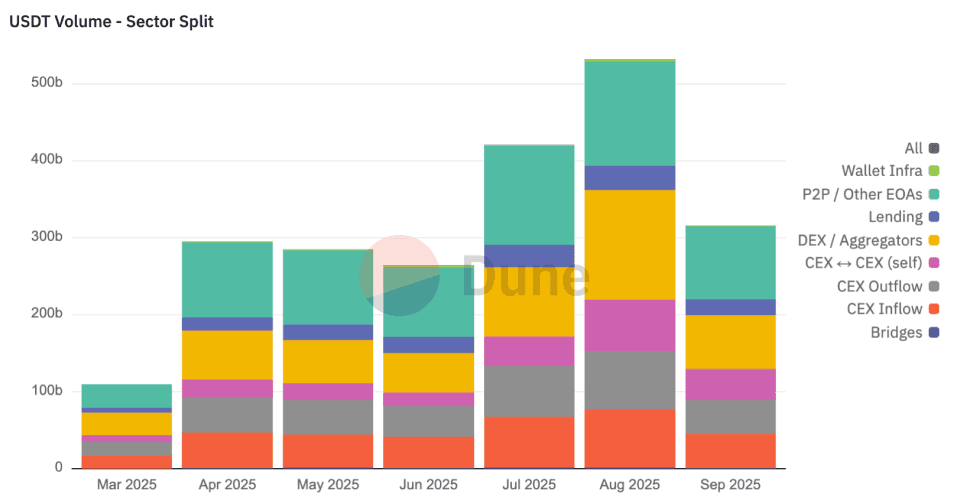
Beyond analysis of volume within categories, we found that CEX outflows generally slightly exceed inflows, reflecting a drive into decentralised solutions despite relative consolidation in the 2025 market.
The largest share of USDT flows is tied to externally owned accounts (EOAs) which are unidentified wallets, averaging approximately $100 billion in monthly volume. This figure is likely overstated, as unlabeled exchange or protocol wallets are automatically classified as EOAs. Nonetheless, it highlights the scale of activity occurring outside clearly identified entities.
These flows suggest stablecoins have a meaningful role as a peer-to-peer payment mechanism. However, given that roughly 90% of total stablecoin volume is non-retail, it is reasonable to infer that much of this EOA-driven activity is dominated by institutional players rather than retail users.
USDT Transaction Categories on ETH
DeFi-related activity is another major contributor. DEX and aggregator flows, along with lending transactions, average around $75 billion per month, indicating stablecoins’ growing role as core liquidity within decentralised finance. In contrast, bridging activity remains limited, representing only a small share of USDT volume relative to overall on-chain activity.
Centralised exchange (CEX) activity also plays a prominent role. CEX inflows and internal CEX-to-CEX transfers consistently account for 20–25% of total volume, with CEX outflows generally exceeding inflows, indicating that more funds are moving on-chain into decentralised solutions than the inverse.
Overall, this breakdown shows stablecoins are deeply integrated across both centralised and decentralised environments. While exchange activity accounts for a significant share of volume, DeFi adoption is meaningful, and the most substantial amount of transactional activity occurs between private entities in the EOA bucket pointing to stablecoins’ role as both a settlement layer for institutions and a transactional medium in peer-to-peer market.
USDT Activity on TRON
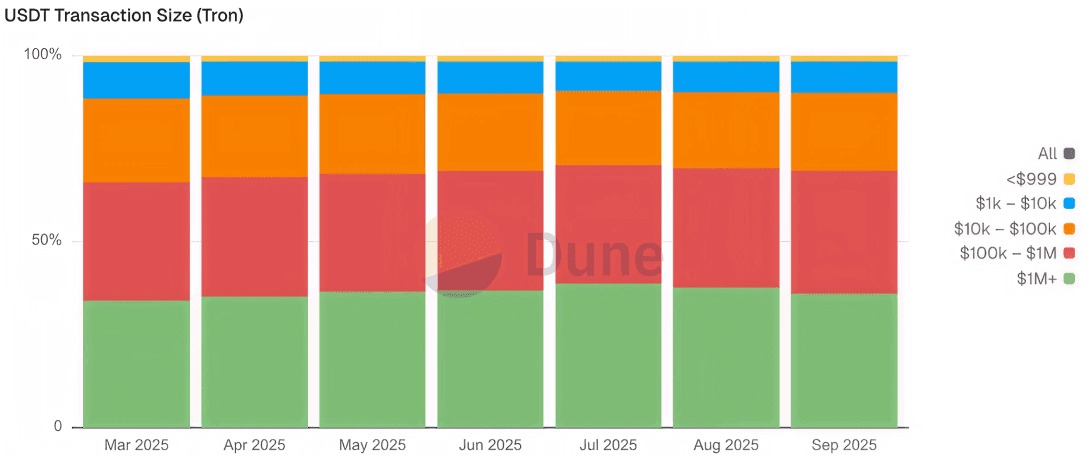
We include USDT activity on Tron, despite its relative lack of dApps and institutional presence.
Whilst USDT on Ethereum is primarily oriented toward institutional flows, dominated by transfers above $1 million, USDT on Tron exhibits a more balanced distribution. Large transfers remain significant but are not dominant, while mid-sized transactions between $100,000 and $1 million are equally prominent. Notably, smaller transfers between $1,000 and $100,000 consistently account for roughly one-third of total volume, suggesting a higher degree of peer-to-peer and retail activity compared with Ethereum.
TRON’s Retail Focus
While Ethereum hosts a more developed ecosystem for DeFi, institutional adoption, and on-chain integrations, USDT is actually traded more actively on Tron, with September 2025 seeing just under $500 billion in volume compared to Ethereum’s ~$310 billion.
Even after manually tagging dozens of CEX and DEX wallets, the majority of flows remain associated with unlabelled addresses. This suggests that most on-chain activity is conducted by individual accounts that cannot currently be attributed to either genuine peer-to-peer transactions or unidentified entities.
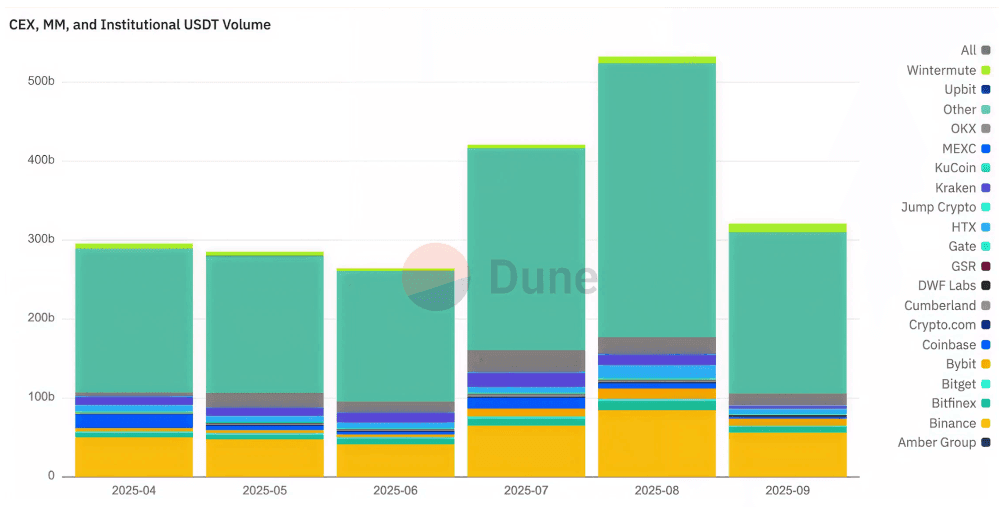
Biggest Players (on ETH)
Going back to Ethereum, following our analysis of USDT activity by transactional type, we wanted to understand which players where dominant. We explored 100+ tagged hot wallets of major exchanges and market makers. We found that leading CEXs such as Binance, Coinbase, and OKX, along with firms like Wintermute, Cumberland, GSR, and Amber Group, account for a significant share of stablecoin flows. However, the “Other” category, representing untagged wallets, still constitutes the majority of activity and highlights the opacity that persists in on-chain flow classification.
Despite the persistently large “Other” category that can be attributed to retail, unmarked wallets of the players we looked at, or different players we haven’t considered, the fact that such a sizeable share of the remainder of the bar chart is controlled by labelled large entities and liquidity providers that deploy capital at scale across the ecosystem, deeply showcases the power of the incumbent centralised institutions, be that direct monetary capacity or facilitation for others.
USDC DEEP DIVE
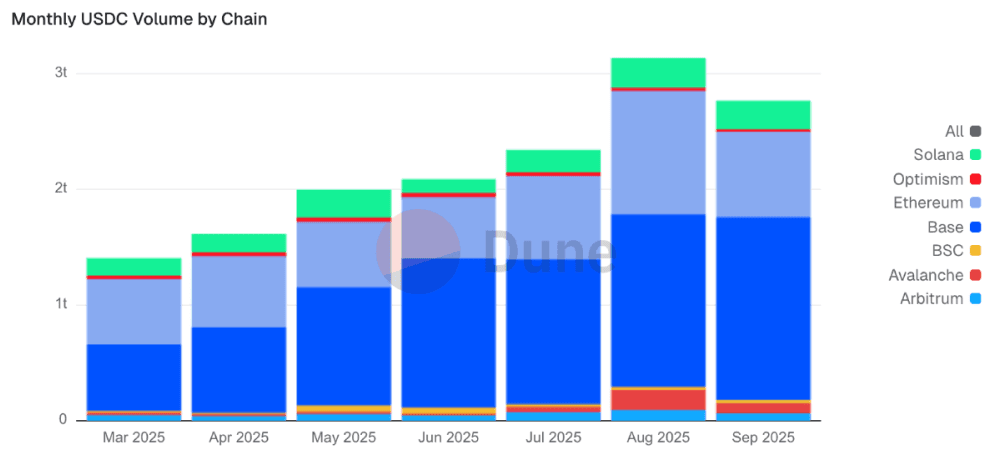
USDC Volume Overthrows USDT
Despite being the second-largest stablecoin by market capitalisation, USDC continues to play an outsized role in on-chain activity. Its transfer volumes consistently surpass those of USDT, underscoring its importance as a settlement layer. Cumulatively, in 2024, USDC processed $17.7 trillion in transaction volume compared to USDT’s $9.8 trillion, and year-to-date figures show the same trend, with USDC reaching $22.6 trillion against USDT’s $12.1 trillion.
The volume dominance hints at USDC’s role as the go-to stablecoin for on-chain transfers, and network distribution reinforces that trend. Between March and August, USDC activity on Base accounted for an average of 50% of its total volume, while Ethereum captured around 33%. The strength of Base suggests that it has become the leading hub for USDC flows, reflecting both the rapid adoption of Coinbase’s L2 and USDC’s positioning as the preferred stablecoin for on-chain activity.
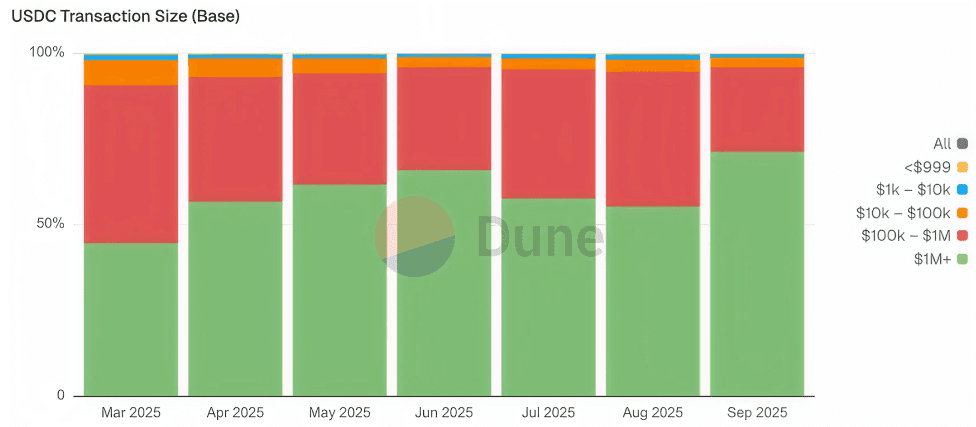
USDC Finds A New Home In Base
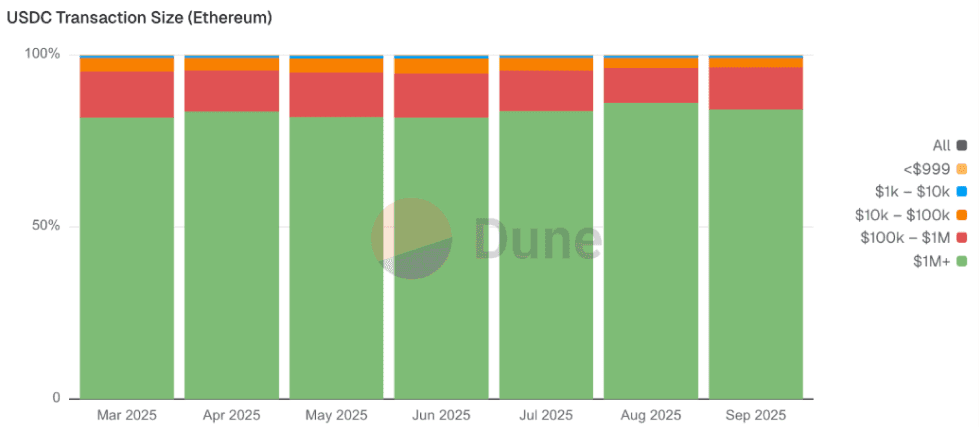
Coinbase’s L2 Network, emerged as the primary venue for USDC, accounting for nearly 60% of all network activity. What stands out is the dominance of very large transfers, highlighting Base’s role as infrastructure for institutional and high-value settlement rather than retail usage. From March to August, transactions exceeding $1 million consistently represented around 57% of total volume, while those in the $100,000 - $1 million range accounted for another 37%.
In contrast, mid-sized and smaller transactions make up only a tiny share of activity. Transfers between $10,000 and $100,000 represented just 4.5% of monthly volume on average, while those below $10,000 barely reached 1.5%. This contrast highlights how USDC on Base is concentrated in large-scale flows, which could suggest its utility is currently driven by liquidity provisioning, treasury management, and other institutional-grade use cases rather than everyday payments.
USDC Activity on Ethereum
While Base is the leading venue for USDC flows, Ethereum remains a critical part of the ecosystem, capturing around 33% of transaction volume between March and August. This importance can be attributed to the fact that Ethereum hosts a larger range of dApps and DeFi integrations for USDC to be used beyond simple transfers.
On-chain transaction data also reveals how USDC on Ethereum concentrates large-scale flows exceeding 1 million, consistently accounting an average of 83% of all volume, while those between $100,000 - $1 million represent 12% on average. Mid-sized transfers, of $10,000 to $100,000, add just around 4%, and transfers worth less than $10,000 are only a miniscule fraction at less than 1% of all transfer volume. This distribution reflects how USDC on Ethereum is even less used for retail-sized activity than on Base, with volume overwhelmingly concentrated in multi-million dollar transfers.
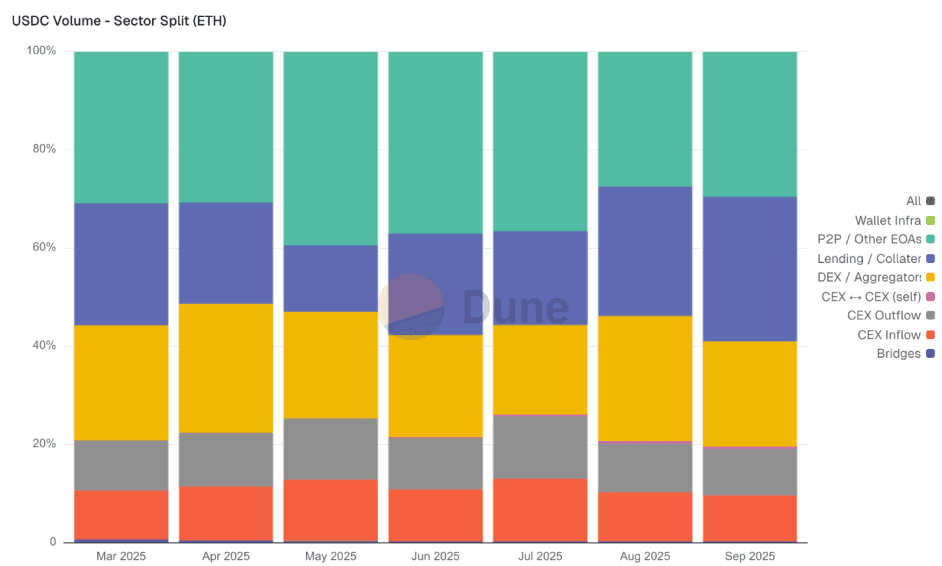
USDC Transaction Categories
This chart presents our analysis of USDC activity on Ethereum, segmented by address types. From March to September 2025, USDC activity on Ethereum shows a clear shift toward DeFi. Early in the period, flows were more evenly split between EOAs (~35-40%) and DeFi protocols (~40-45%).
By August and September, however, DeFi-related volumes surged to over half of all activity, driven mainly by growth in lending and collateral use, while EOA share fell closer to 30%. Centralised exchange inflows and outflows remained steady at around 20-25% each month, and bridge activity was negligible throughout. Overall, the trend highlights USDC’s increasing role as core liquidity for DeFi protocols rather than just peer-to-peer or exclusively exchange-driven settlement.
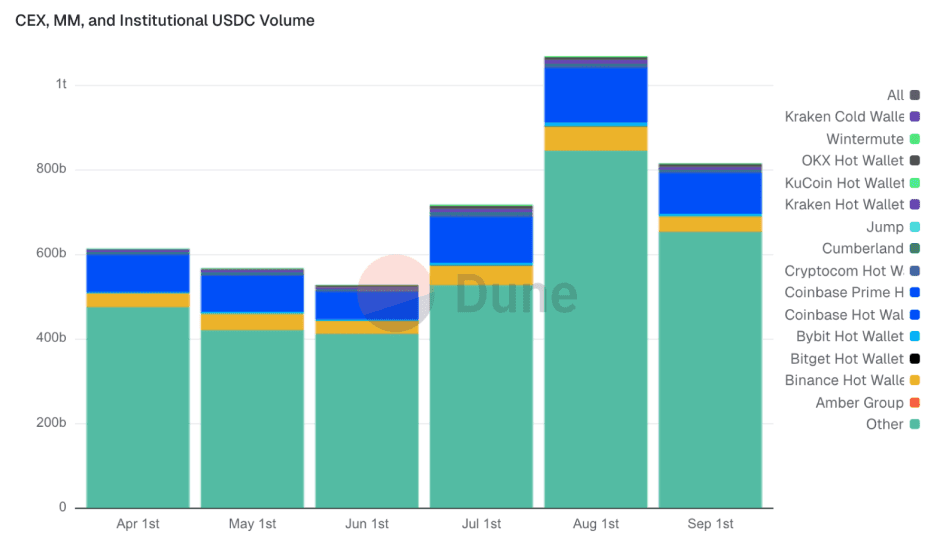
USDC Breakdown by Biggest Players
In the case of USDC, the breakdown after tracking hundreds of wallets shows that much like with USDT, a large share of USDC flows on Ethereum are concentrated in tagged institutional players. Coinbase hot wallets, Binance, OKX, and KuCoin stand out among CEXs, while market makers like Cumberland, Jump, and Wintermute are also significant. Despite this, the “Other” category dominates consistently across months, meaning the majority of volume still comes from untagged wallets, whether that’s retail, OTC desks, or unidentified institutional players.
The July-August spike is notable, where total volume peaked, again driven primarily by the “Other” bucket but with clear contributions from Coinbase and Binance. This suggests that while exchanges and market makers deploy meaningful capital at scale, the opacity of unclassified flows remains a core feature of USDC settlement on-chain which cannot be fully broken down given the lack of counterparty tagging, leaving much activity grouped as “Other”.
Conclusion
Stablecoins have become critical components of digital finance, facilitating large-scale capital flows and serving as essential infrastructure for institutions and retail users alike. The market remains dominated by dollar-pegged assets, with USDT and USDC capturing over 80% of market cap and driving most transaction volume. Reliable collateralisation through Treasury securities, cash equivalents, bank deposits, or crypto-backed reserves is foundational to stablecoin stability, with regulatory frameworks like the U.S. GENIUS Act and EU MiCA further reinforcing these standards.
Yield-bearing stablecoins represent an innovative extension, combining price stability with automated income generation via derivatives hedging, money market fund tokenisation, and other strategies. Leading models illustrate varied tradeoffs in risk, yield, and operational design, so investors need to do careful due diligence to find an option most suitable to their risk and yield appetites.
At Simplicity Group, we believe that the integration of stablecoins into day-to-day banking is not only inevitable, but has already happened for tens if not hundreds of millions of people, and it will only continue to grow. The sector has proven itself to be reliable and safe, and the early entrants, beyond USDT, USDC, and Ethena, are going to only grow bigger; to be cliche, we are early, and we are looking forward to what the future holds.
Sources
https://www.chainalysis.com/blog/2025-global-crypto-adoption-index/
https://visaonchainanalytics.com/transactions#adjusted-transaction-methodology
https://www.chainalysis.com/blog/2025-global-crypto-adoption-index/
https://www.theblock.co/data/crypto-markets/public-companies
https://defillama.com/
https://dune.com/simplicity1group/mapping-the-stablecoin-economy
https://dune.com/simplicity1group/stablecoins-by-chain