Research
Jul 24, 2025
Token Launch Dynamics: The Science Behind Price Performance
Executive Summary
Analysing 50,000 data points to understand the relationship between price performance and key launch parameters, notably marketing and tokenomics.
This research paper explores over 50,000 data points from 40 projects to analyse the levels of correlation between popular industry paradigms and price performance. Moreover, we conducted analysis into each project individually to get a deeper understanding of their approach to the metrics we analysed and gather some quantitative data to compare - this will be posted as a separate report.
It is not possible to determine causality, however, we have uncovered interesting correlations, or lack thereof, between price performance and the following factors:
Twitter engagement
Initial Circulating Supply
Initial Market Cap
Volume
Fundraising amount
Twitter engagement - likes, comments, reposts, and overall impressions - bear almost no correlation to price performance.
Initial Circulating Supply bears no correlation to price performance.
Initial Market Cap has the strongest correlation of 0.01 to price performance, and is the most critical aspect of a successful token launch out of all parameters we looked at.
Volume has strong rank correlation to price performance, implying that the death of the project is tied to the death of the token economy and vice versa.
Fundraising amount has no correlation to price performance.
Whilst the report has limitations, not least of which being that we didn’t account for overall market conditions during and after the listing of each project, the relative comparison between the projects still shows statistically significant correlation or greatly statistically insignificant correlation so as to making the research useful in a variety of ways.
1. Getting Started
Introduction
In 2025, the crypto space is flooded with new tokens; each claiming revolutionary tokenomics, groundbreaking products, or unbeatable marketing. But what actually separates the winners from the rest? Our research cuts through the hype. We analysed real projects (excluding memecoins) with live products to uncover patterns linking tokenomics, fundraising, marketing, and short-to-medium-term price performance. Our goal? To identify what genuinely moves the needle for token success in today’s crowded market.
What is a token launch?
A token launch marks the official entry of a new cryptocurrency into the market, where tokens are listed on either Centralised or Decentralised Exchanges. This is different to a token launch which is the creation of the token on the blockchain itself, however, these tokens cannot be traded until they are launched on an exchange. The token launch strategy encompasses everything the team did prior to the launch: fundraising strategy, tokenomics design (supply, allocation, vesting), marketing execution, and the underlying product’s viability. Crucially, it determines whether a project gains sustainable traction or fades into obscurity.
What defines a successful token launch?
Success in token launches is multifaceted and often subjective. Founders may prioritise the revenue made from selling the token, communities might value hype (X's on launch day), and long-term builders focus on sustainable frameworks. For this report, we anchor our definition in a critical, measurable outcome for all stakeholders: short-to-medium term price stability and growth. We specifically track the token's market price at three decisive moments:
Initial Listing Price: the starting benchmark;
Price 7 Days Post-Launch: capturing immediate post-hype sentiment;
Price 30 Days Post-Launch: reflecting early vesting impacts, sustained community engagement, and real product traction.
We chose these metrics because price action (especially holding gains through the volatile first month) is a direct indicator of market confidence. It signals whether the launch attracted real users or speculation. While not the only measure of
success, it’s an objective pulse check on whether the launch execution was successful.
Report Objective
Seeing as token launches make or break projects, getting them wrong leads to almost certain death of the project and often causes significant FUD. This report exists to arm founders with a data-driven playbook for successful token launches.
We analysed 40 major 2025 launches to answer your critical questions:
Is there a marketing pattern that facilitates a better launch?
How does the IMC impact the launch?
How does the circulating supply impact the launch?
Does volume correlate to price performance?
Do projects that raise more have better price performance?
We tried to cover a wide array of areas that we believe contribute significantly to the success of a token launch, notably the marketing efforts (focused on social media (X)) and tokenomics.
Whilst it is impossible to determine causality between the factors we analysed and price performance, it is clear that there are significant correlations between projects that do well and those that do not. As such, this report is not designed to provide a magic check list of things to do to have a successful launch, but it is certainly able to explain what to avoid and what to imitate to maximise your chances of a successful launch.
Methodology
Data Collection Process
We began by compiling a list of all token launches between January 1 and April 30, 2025. We applied three filters to identify the projects we would select. First, we included only projects with a minimum fully diluted valuation (FDV) of $10M at launch and time of the analysis. Second, we excluded memecoins and non-serious projects. Third, we required demonstrable traction through venture capital backing, strategic partnerships, or social engagement. This left us with 40 projects to explore.
For each of the 40 projects, we executed a data collection strategy targeting four critical domains. Overall, over 50,000 data points were gathered.
Tokenomics:
Tokenomics was prioritised. We documented token allocation percentages across four distinct stakeholder groups: insider holdings for teams and investors, community distribution mechanisms like airdrops or rewards, treasury reserves for project development, and liquidity. Vesting schedules - token launch unlocks, cliff periods, and the token unlocks, were also tracked.
All tokenomics data underwent cross-verification between project documentation, and analytics platforms including Cryptorank, CoinMarketCap, and Tokenomist.
Fundraising:
Fundraising context formed our second dataset. We recorded the total capital raised, the investors, and tier of investors. CryptoRank, and DeFiLlama provided us with the fundraising data.
Marketing:
Marketing was the third set of data collected. We constructed a framework isolating three launch-adjacent 1 week periods: pre-launch, launch week, and post-launch.
We aimed to capture ~15 tweets for the week prior and post token launch, whilst capturing every tweet during the launch week itself. We logged the amount of likes, replies, reposts, and impressions on every tweet. Moreover, we used qualitative assessment to manually tag post purpose, type, and tone.
Purpose distinguished between campaign related, community, partnership/news and product.
Type distinguished between calls to action, straightforward, hype and teaser.
Tone distinguished between positive, neutral, or negative tone.
Price:
Price tracking finalised the dataset. We manually sourced token prices at three points in time: the first available exchange listing price, the price exactly seven days after listing, and the price thirty days after listing. Data aggregation relied exclusively on CoinGecko and CoinMarketCap feeds, with values cross-checked across both platforms to flag and reconcile outliers or exchange-specific anomalies.
Data Analysis and Visualisation Tools
We used Python (more specifically the Pandas, NumPy, Seaborn, and Statsmodels libraries) to process and analyse the data across all of the 40 observed token launches. Initial Market Cap (IMC) was calculated by multiplying initial circulating supply by launch price. We explored relationships between social engagement, IMC, and token returns using Pearson correlation matrices and scatter plots, which allowed us to observe the magnitude and direction of linear relationships between engagement metrics, IMC, and short-term price returns.
To quantify the impact of engagement, IMC, and volume supply on 1-week and 1-month price performance, we ran Ordinary Least Squares (OLS) regressions, which enabled us to isolate the effect of each independent variable such as pre-launch reposts or IMC. We assessed the statistical significance of each variable through p-values, and interpreted their coefficients to understand the magnitude and direction of their impact on price returns, while keeping in mind the R² and adjusted R² to evaluate model quality.
We applied a log transformation to the Initial Market Cap (IMC) before using it in correlation and regression analysis. The main reason was that the IMC values were heavily skewed, ranging from low millions to well over $140M, which could distort our statistical models. In a few words, the Log transformation compresses large values and stretches small ones, making the data more normally distributed and reducing the influence of extreme outliers.
More importantly, taking the natural log of IMC allowed us to model proportional changes rather than fixed ones. For example, increasing IMC from $5M to $10M should have a similar impact on price performance as increasing from $50M to $100M since both are 2× increases; using log(IMC) lets the regression treat these relative jumps consistently, which better reflects how investors and markets behave in response to launch valuations.
Because we used the natural logarithm of the Initial Market Cap (IMC), each 1-point increase in log(IMC) corresponds to the IMC growing by a factor of approximately 2.7 (because of e = 2.718). This means the regression isn’t measuring the effect of IMC growing by $1M or $10M in absolute terms, but rather the effect of multiplying some IMC value. For example, going from a $5M to a ~$13.5M IMC (+1 in log scale) is treated the same as going from $20M to ~$54M as both represent a similar proportional increase.
Tokens in the Analysis
Amnis Finance
Avalon Labs
Babylon
Berachain
CreatorBid
Bubblemaps
Bedrock
Bucket Procotol
Camino Network
Corn
Derive
DuckChain
Elixir
Mind Network
GoPlus
Gunzilla
Hyperlane
Story Protocol
Kinto
Kaito
Kernel
Keeta
Solayer
Nillion
Orbiter Finance
Particle Network
Plume Network
Powerloom
Quai Network
RedStone
MyShell
Solv
SonicSVM
SoSoValue
StakeStone
Walrus
WalletConnect
Xterio
Zora
Limitations
Limitations
This research, while rigorous in methodology, operates within constraints that may impact the interpretation of our findings. As with any analysis of market dynamics, several factors introduce inherent limitations to our conclusions:
Constrained Sample Scope
Our dataset encompasses 40 token launches meeting stringent selection criteria, such as the minimum $10M FDV and exclusion of memecoins. While this focused approach ensured the analysis of what we believe to be high-quality projects, the limited sample size reduces statistical power and increases susceptibility to outlier influence. We deliberately included projects across a spectrum of fundraising scales and engagement levels to enhance representativeness, however, the rapidly evolving nature of the 2025 launch landscape means these findings may not fully encapsulate broader market patterns or emergent tokenomics innovations outside our sampling window.
2. Unrefined Engagement Metrics
Twitter engagement data (impressions, replies, reposts, and likes) was aggregated without normalisation for follower count or posting frequency. Crucially, we did not differentiate between positive and negative sentiment in engagements, nor whether said engagement was genuine community enthusiasm or farming/bots. This limitation potentially impacts our analyses about the correlation between engagement and price performance.
3. Linearity Assumption in Analytical Models
Our reliance on linear regression frameworks presupposes straightforward relationships between variables like insider allocation percentages and price returns. Cryptocurrency markets, however, frequently exhibit threshold effects and non-linear dynamics where small changes in one factor trigger disproportionate impacts beyond certain tipping points. For instance, the relationship between vesting schedules and sell pressure may follow logarithmic rather than linear patterns; our models cannot capture these complex interactions.
Exclusion of Macro Market Context
The analysis deliberately isolated project-specific factors without adjusting for broader market conditions during each token launch as it was too complex to quantify the weight of each exogenous factor on the correlation data. Total Market Cap changes, Bitcoin dominance shifts, sector-specific narratives (e.g. DeFi summer resurgence), or macroeconomic events like regulatory announcements significantly influence short-term returns irrespective of a project's fundamentals. A token launching during a market-wide liquidity surge might outperform despite weak fundamentals, while superior projects may underperform during bearish swings, albeit from January to April the market has been dropping in value.
Date of Research Collection
This research was conducted on projects that launched between January and April, yet is being published late June. In the last two months of writing this report, we have not seen any noticeable changes to the market that deviate from our findings, alas, it is worth noting that the crypto industry moves fast, so new patterns may be emerging that deviate from our analysis.
Missing Data
Some data was missing for projects, such as their fundraising amounts, or tokenomics. We conducted the analysis without the data for these projects, which may have skewed the results.
These limitations do not invalidate our findings but define their boundaries. We present them transparently to equip founders with the appropriate contextual lenses when applying these insights to launch strategy formulation.
Statistical Analysis
Overview
As aforementioned in the methodology section, we analysed 40 token launches from 2025 to explore what factors actually have an impact on short term price performance. We tested 4 separate hypotheses with our statistical analysis for this report:
Does higher engagement around token launch week correlate with better price performance?
Do Initial Market Cap and Supply correlate with better price return / performance?
Does volume correlate to 1-Week and 1-Month price return / performance?
Is there a relationship between the amount of funds raised an 1-Month price return / performance?
Hypothesis 1: Does higher engagement around token launch week correlate with better price performance?
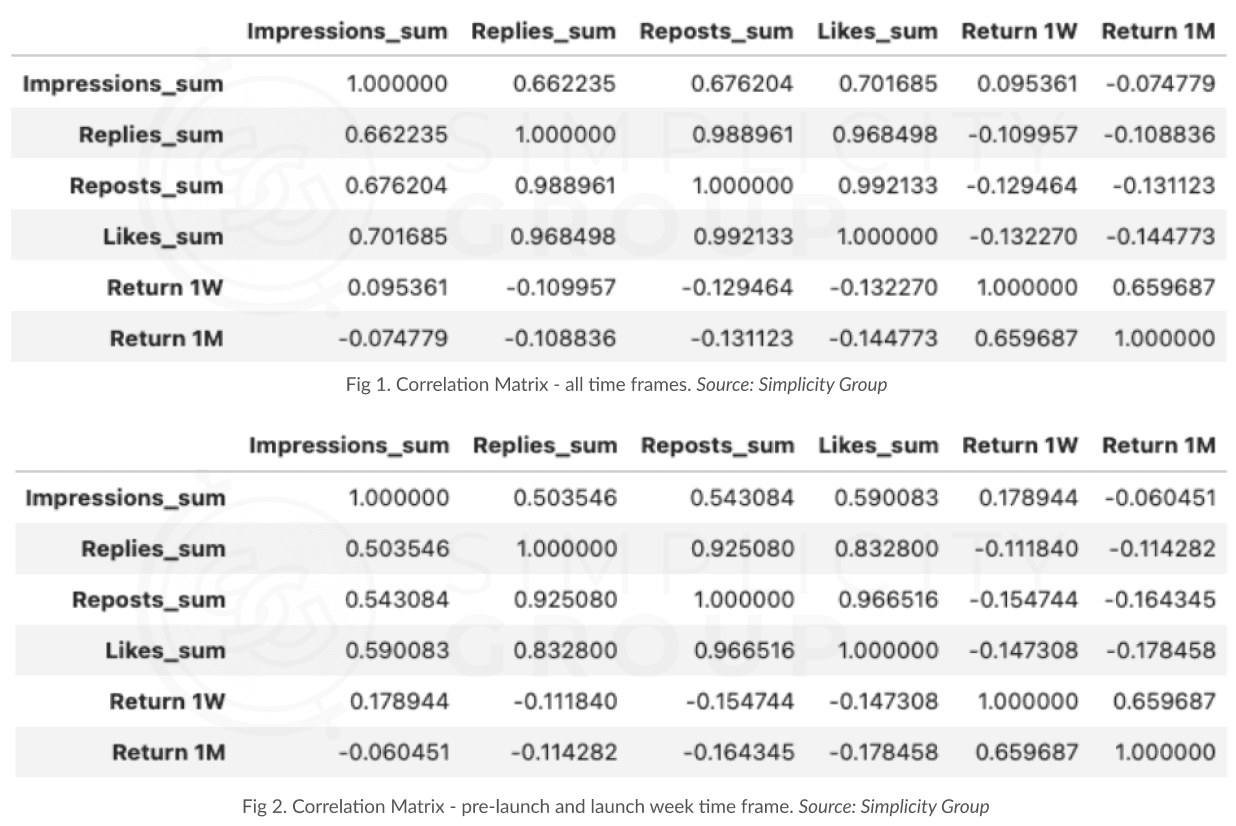
We first tried to test the common belief in crypto that more engagement on Twitter before launch leads to better price performance. By looking at the tweets’ impressions, likes, replies, and reposts during the pre-token launch and token launch week periods, the first big insight was that replies, reposts, and likes are all closely tied together with correlations mostly between 0.96 and 0.99, whereas impressions were nowhere near as closely correlated at 0.66-0.70 (Fig. 1).
For this reason, our next step was to make a similar analysis to know if tweets from a certain time frame have more impact than the others. All together there is no correlation, but, are pre-token launch and launch week tweets more effective than those posted after token launch?
What we found was interesting. The correlation matrix (Fig. 2) shown below indicates that there’s no statistically significant link between interactions (replies, reposts, likes) and price performance specifically before and during launch. However, it seems to indicate that interactions are actually negatively correlated with returns within both, 1-week and 1-month time frames - meaning that the more replies, reposts, and likes a project had, the worse its price performed. This is statistically insignificant correlation, and not causation, yet, something to note.
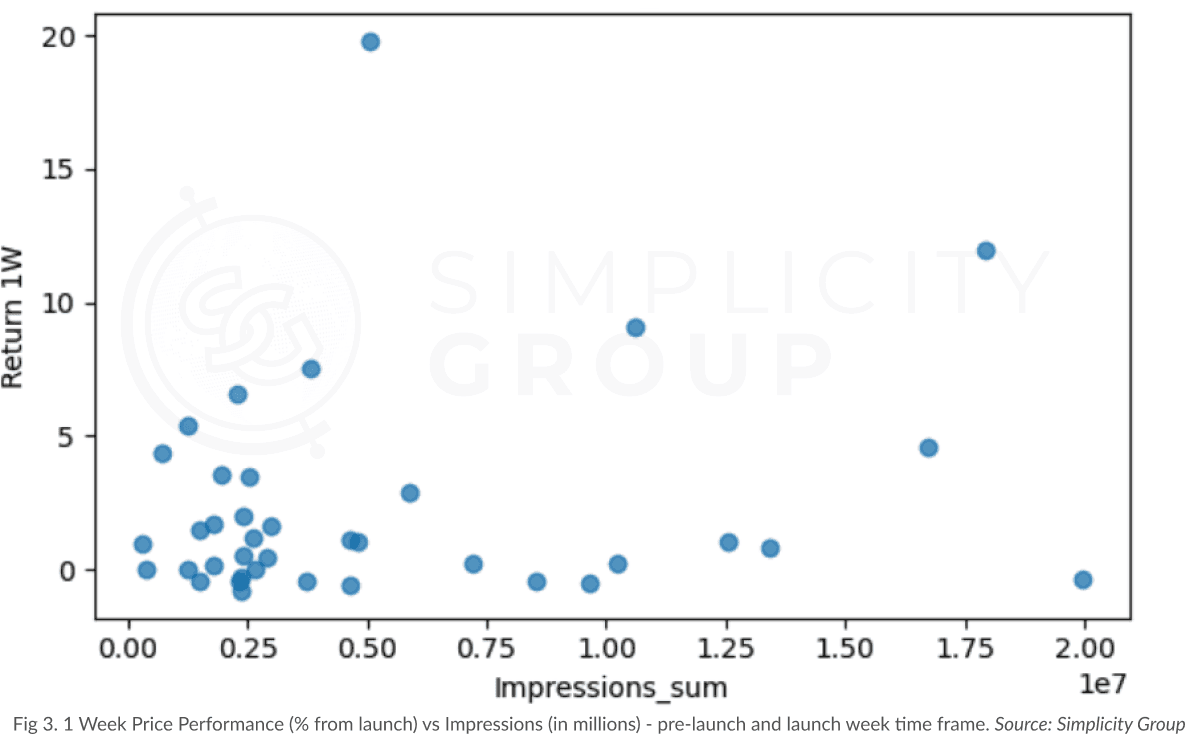
Isolating impressions and the 1 week time price performance post launch, for ease of analysis, we created a scatter plot (Fig. 3), where we see that impressions had the least correlation to price action.
After this, we knew that impressions before and during the token launch have only a slight effect on token’s price performance, but it’s overall a weak model. And on another hand, we see that engagements, such as Likes and Reposts, even show negative correlations.
For this reason, our last attempt at analysing the effect of engagement on price was to separate the pre-token launch and token launch tweets to analyse their singular effect on price, to try to find out if either of them has even a slightest edge over the other. We ran a regression analysis (Fig. 4) that separated the effects of engagements between pre-token launch (TGE in Figure) and token launch time frames.
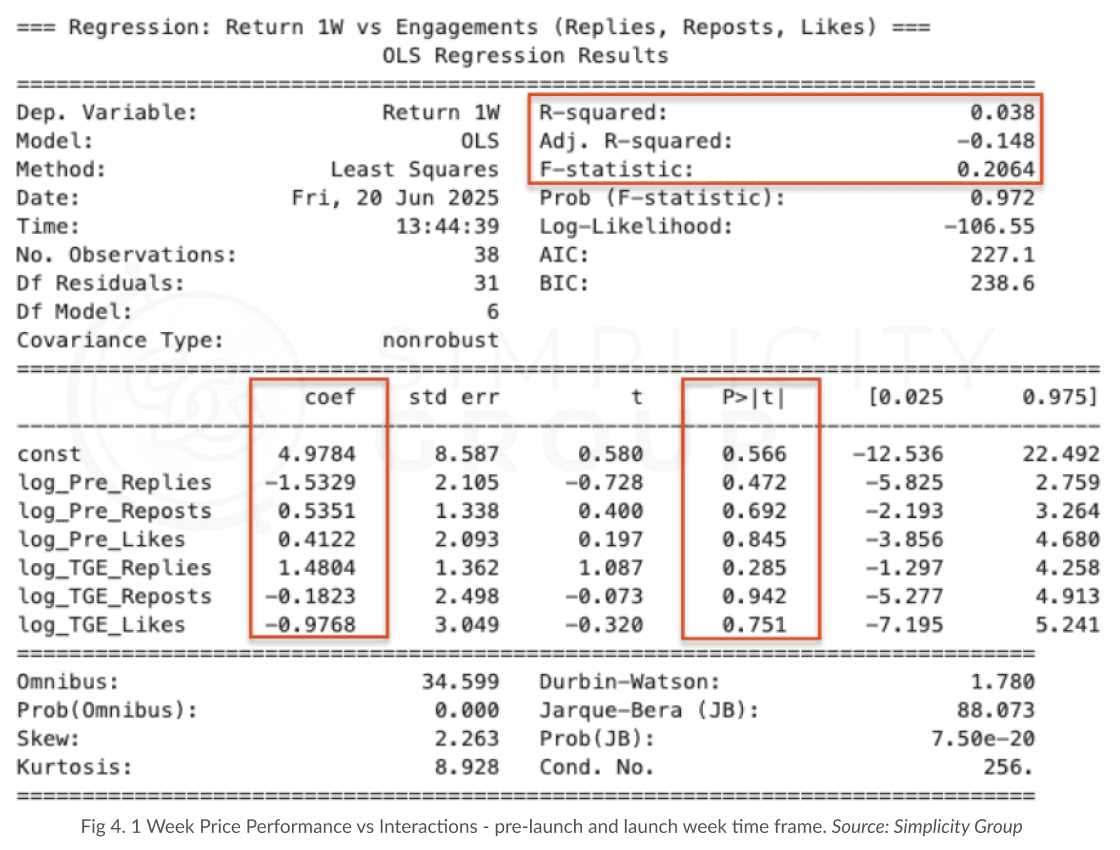
As we can appreciate in the OLS model shown above, the R² of 0.038 and Adjusted R² = -0.148 show that overall model fit is very poor. This means that basically the model is not able to explain any of the variation in 1-Week price returns. Looking at the breakdown of the variables, with their coefficients and p-values, the analysis indicates that none of the engagement metrics, not even reposts, showed a significant or even directional effect on 1-Week returns.
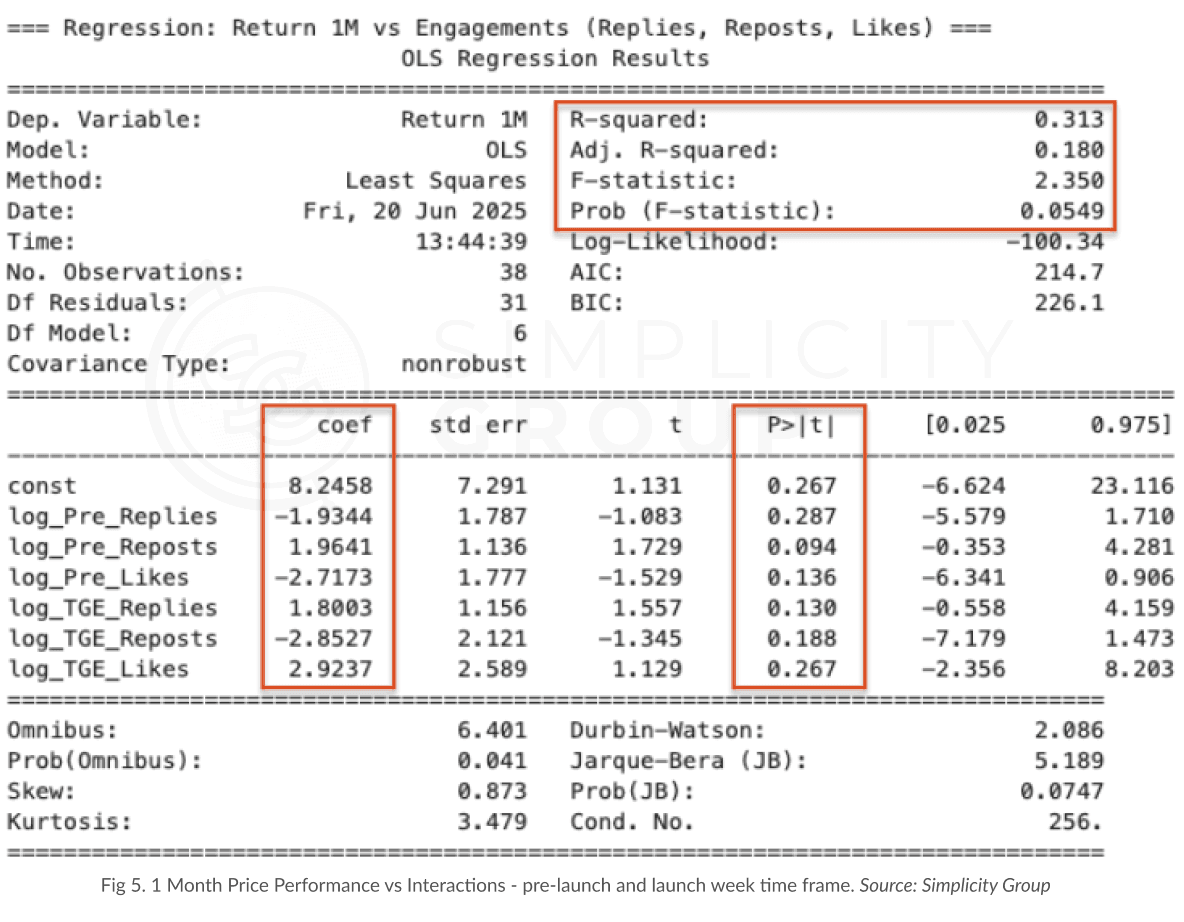
Nevertheless, running the same analysis for 1-Month returns (Fig. 5) led us to a model with a much better fit that the one for 1-Week price impact. This is likely due to the noise and hype surrounding token launches that greatly skew results, whereas after 1 month the fundamentals start to shine through again. With an R² = 0.313, Adjusted R² = 0.180, and an F-statistic p of 0.0549, it threw much stronger insights than the 1W model. What this model tells us is that one metric really stands out: Pre-TGE Reposts.
Since log_Pre_Reposts has a positive coefficient and a p-value closer to 0.05 - at 0.094, it suggests that projects with more reposted tweets before launch had stronger 1-month performance.
Overall, while social engagement doesn’t have an influence on 1-week price, reposts before the launch week may support longer-term performance. This could be due to building a broader base of awareness and buyers before the token is live, whilst avoiding FOMO or hype-driven buyers if you heavily publicise the token during the token launch.
So, after this analysis we see that based on our data base only the pre-token launch reposts trend is approaching statistical relevance and may support longer-term performance.
Hypothesis 2: Does Initial Market Cap (IMC) and initial circulating supply (float) correlate with better price performance?
Then we shifted our analysis to tokenomics to try to see if these more technical aspects of a token launch had any impact on price performance at the one week or one month price. Notably, we are trying to answer another question in crypto: whether tokens that launch with lower IMC and a lower initial circulating supply (commonly referred to as initial float), perform better due to scarcity and more attractive demand and supply dynamics.
We took each of the token’s initial circulating supply and initial market cap and analysed whether these metrics correlated with 1-Week and 1-Month returns.
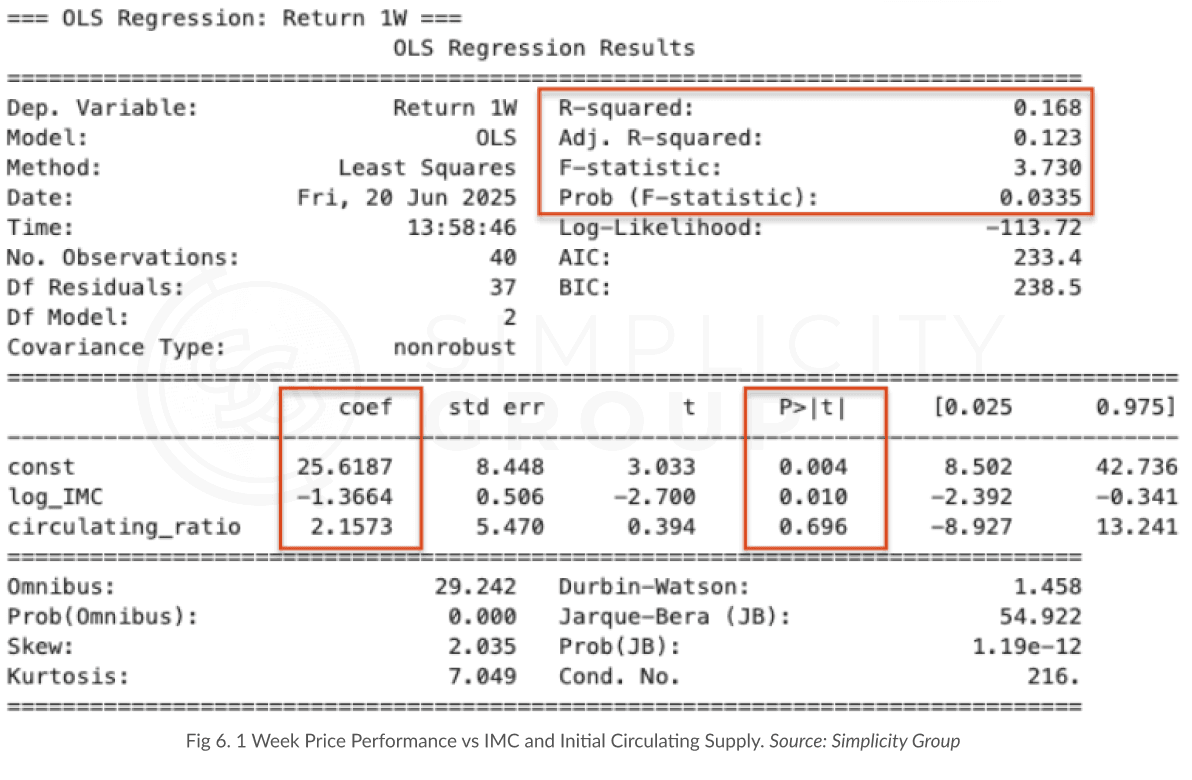
Shown in the data below (Fig. 6), the regression model between 1-Week returns vs IMC and Initial Circulating Supply (Circulating Ratio) is statistically solid. This is mainly due to the R² of 0.168 and Adjusted R² of 0.123, which means that the model explains ~17% of 1-week return variation, and the F-stat p of 0.0335 indicates that the model is statistically significant.
So, after analysing the coefficients, we see that log(IMC) is a strong negative predictor at -1.37 and a p-value of 0.01. 1-point increase in log(IMC), 1-Week return drops ~1.37 units.
In English, this translates to: if a project had an IMC of $1M, its token price will be ~1.37% higher relative to launch, than if it had an IMC of $2.7M (this 2.7x multiplier is the “1-point increase in log(IMC) explained further in the Methodology section); and if it had an IMC of $2.7M will have a token price ~1.37% higher than if it had an IMC of $7.3M; and so on.
This is clear evidence that higher IMCs lead to relatively lower token performance.
However, interestingly, we also see how the initial circulating supply has no effect whatsoever, with a high statistical significance; float is not relevant to predict 1-Week price performance.
This also confirms something really critical: it is not the percentage of the supply unlocked at launch that matters, but the total dollar value of the initial float.
This first model for IMC and initial circulating supply confirmed the idea that launching with a low initial market cap is critical for strong 1-Week price action. This could be due to the establishment of a market that easily favours momentum with scarcity and more buying pressure.
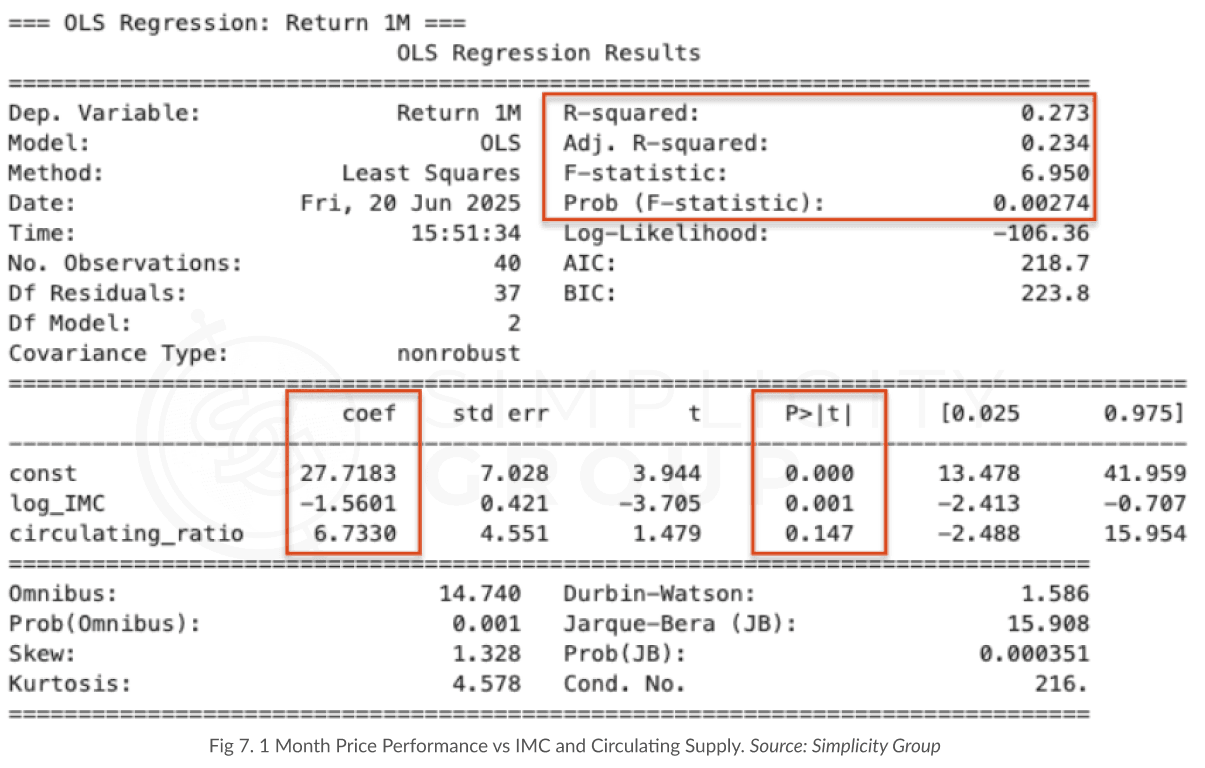
Now looking at the same regression analysis but for the 1-Month price performance (Fig. 7), the model is also significant with an R² of 0.273 and an Adjusted R² of 0.234. In other words, this model is able to capture over a quarter of the variance in 1-Month returns.
Focusing on the coefficients and p-values, once again we see that log(IMC) is really strong with a coefficient of -1.56 (higher than -1.37 on 1 Week time frame), and a low p-value. This supports with even more strength than the 1-Week model, that a lower IMC doesn’t just give a short-term pump, but it may sustain performance during at least the first month.
On the other hand, the circulating supply at launch doesn’t seem to matter statistically, once again. But it helps us to confirm that the IMC is the dominant supply-side factor to drive better performance.
Hypothesis 3: Does volume correlate to 1-Month price?
We collected the total token volumes from token launch day, on the day 1 Week post-token launch, and on the day 1 Month post-token launch. With the data, we’ve analysed how volume retention* after a token launch correlates with price performance.
*Volume Retention = how much of a token’s initial trading volume (from token launch day) is still present one month later, calculated as a ratio.
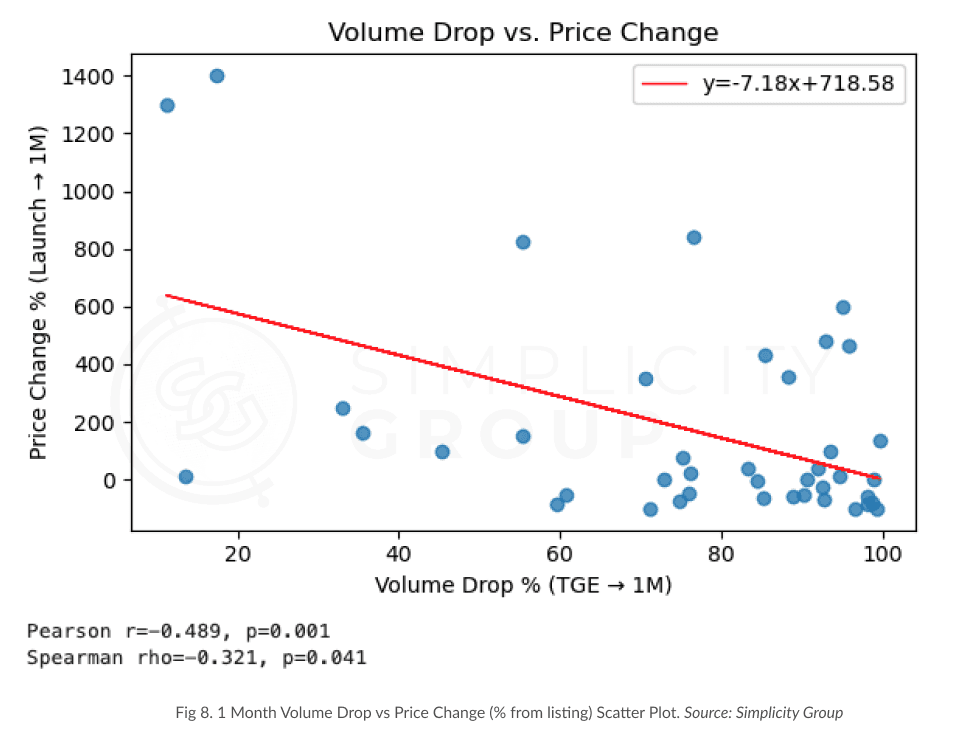
Interestingly, at first glance, there appeared to be no meaningful correlation between trading volume drop and price performance one month after launch.
When we ran correlation tests (Fig. 8), Pearson’s “r” in our results was ~0.045 (p=0.76) which confirmed the lack of linear relationship.
However, Spearman’s rank correlation was -0.356 (p=0.014), indicating a statistically significant relationship: tokens that dropped more in volume tended to perform worse in price.
In simpler terms, while it seemed that performance is not linearly tied to volume, tokens with higher volume retention tend perform better, even if the relationship between the numerical values isn’t linear.
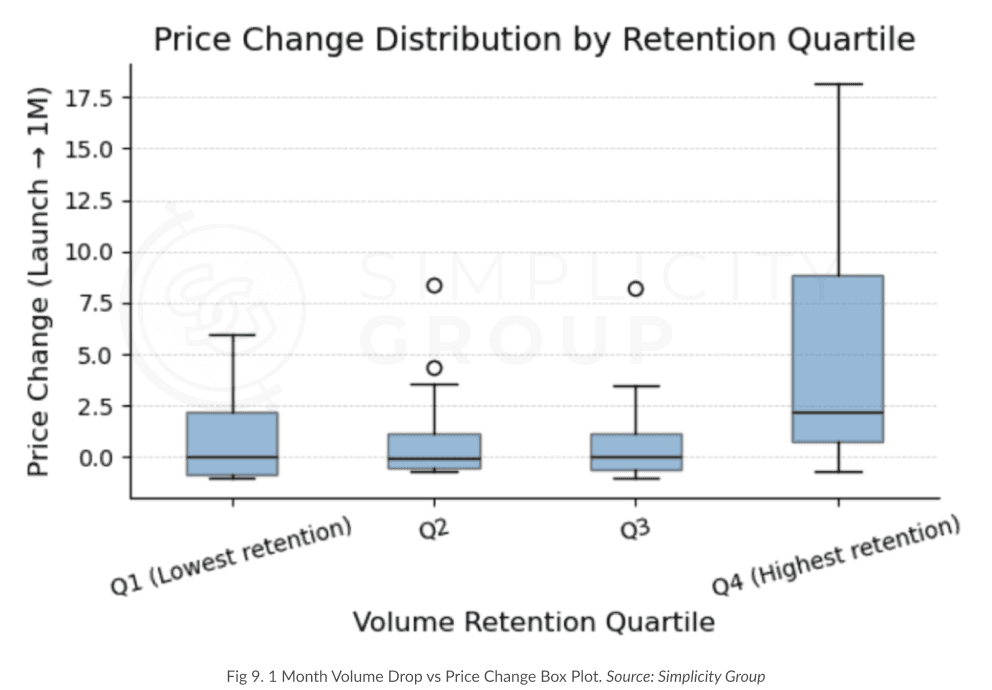
We dove deeper. We categorized the analysed tokens into quartiles based on the 1-month trading volume retention from Q1 (lowest retention) to Q4 (highest).
Early findings from our research indicate that the tokens in the top quartile in the first month post-token launch outperform the rest of tokens that don’t retain their volume as much (Fig. 9); tokens that hold onto their volume tend to hold onto (or grow) their price.
Our analysis concludes that there is a correlation between volume and price performance, with tokens in the highest retention quartile (Q4) showing significantly higher median and mean price performance at 1 month post-launch.
On another hand, the other three quartiles show very low median change, despite the occasional outliers which we didn’t remove since the studied population is already too small (only early 2025 launches).
This means that volume, whilst not being a driver of price performance, is nonetheless a great metric for overall token price health.
Hypothesis 4: Is there a relationship between the amount of funds raised an 1-Month price return / performance?
Lastly, we analysed whether the amount raised by crypto projects before launch has any measurable impact on their token’s post-launch performance. The hypothesis was simple: does raising more money have any type of effect on price?
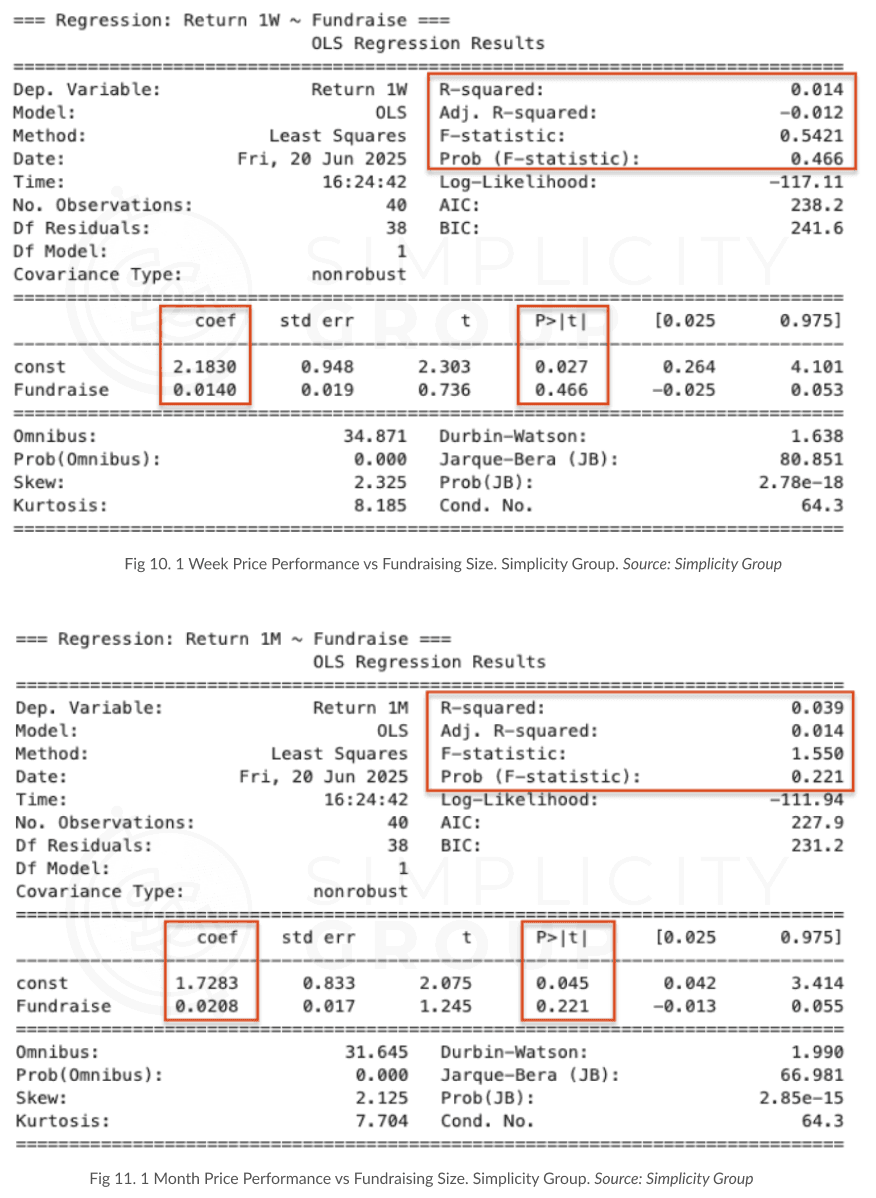
To test this, we analysed the total reported fundraising amounts for 40 tokens (some data was unavailable) and compared them against each project’s token performance on 1-Week (Fig. 10) and 1-Month (Fig. 11) after launch. Overall, raising more money doesn’t predict either better or worse returns either at the 1 week or 1 month mark.
In short, our analysis and data suggest no statistical relationship between fundraising size and price returns:
Fundraise vs 1-Week Returns: 0.1186, correlation factor and p-value of 0.46;
Fundraise vs 1-Month Returns: 0.2, correlation factor and a p-value of 0.22.
Thus, it is evident that the amount of money raised is not indicative of bullish launch price performance.
Conclusion
There is a variety of interesting results we have found after analysing our data. To summarise them:
Statistically, total social interactions and impressions have no significant correlation to the 1 week time price performance.
Likes, retweets, comments in total actually show slight negative correlation with price (albeit, statistically insignificant).
Retweets before token launch, as a data set on their own, had significant positive correlation to 1-month performance.
For every 1-point increase in log(IMC) (an increase in absolute value of 2.7x), 1 Week return drops ~1.37%, and 1 Month return drops ~1.56%.
Initial float (initial circulating supply % of TTS) has no statistical impact on price performance.
Projects with more volume show significantly higher median and mean price performance at 1 month post-launch.
There is no correlation between the amount of money a project raised and its token’s price performance on the 1 week or 1 month time frames.
These results are greatly interesting to us, as they are grounds for paradigm shifts in how we analyse projects before launch, and what founders should focus on to recreate the successful launches.
Many projects focus on quests other engagement campaigns for their marketing, alas, evidently, it is clear that this does not bring a proportionately increased amount of buy pressure. This does not mean there are no indirect benefits, such as an increased brand awareness and ability to negotiate better deals with more popular exchanges, but just because a project is popular on Twitter does not mean its price will do well.
The same is evident specifically with fundraising, where it is evident that projects that raise more money are not inherently better at capturing value in their token relative to their listing valuations.
The low float high FDV debate is also put to rest, with clear evidence of the circulating supply as a ratio of total supply bearing no impact on the price performance, but, the dollar value in the initial market cap having strong correlation - higher the IMC, the worse the price performs.
We explored other relationships between all the data points we collected, notably around tokenomics, and will share them in a follow up report.
Quantitative Analysis
During our individual project analysis, we have found many recurring macro patterns and insights that we analysed in depth, notably around the type of social media activity these projects were pushing out. We have interesting insights surrounding the type of posts that the most successful projects leveraged most, the time of posting, tone, genuineness, and some other interesting metrics.
Product-driven content is key
Products that naturally generate their own content end up winning. The perfect examples so far are Bubblemaps and Kaito, which had massive, consistent engagement because their products organically throw alpha-full content (on-chain investigations for Bubblemaps or narrative tracking for Kaito). Their product basically gives them evergreen content that is also relevant since it’s aligned with what’s trending in the market.
Kaito naturally posts about projects or narratives that are not only trending on their platform, but in the larger crypto community, allowing them to tap into more traffic naturally.
Regardless of the virality of on-chain investigations or narrative tracking, both fundamentally post their platforms, and constantly showcase the benefits of using them - something everyone can imitate.
Tone consistency and understanding
The tone of a project’s posts matters, and it must align with the product and target audience. It's more important to sound “legit” and give people real reasons to care than to jump on trends or shift tone unpredictably.
For example, Powerloom’s $5.2M raise and overly playful tone may not have aligned with expectations for an Ethereum L2. POWER collapsed by 77% in its first week and is down 95% since its launch.
But even if the playful tone aligns with the project’s mission, it won’t be sufficient by itself. Zora’s slogan of “Every post is a memecoin” aligns with their brand identity, yet ZORA is down 75% since launch. Memes alone won’t secure a loyal community, and playful content must be supported by a good underlying product.
On the contrary, Walrus, despite being a heavy infrastructure project with $140M backing, leaned into humour authentically and saw its token jump 357% one month after TGE (still +192% since).
And to go to the extreme side of seriousness, Hyperlane's posts avoided hype and stuck to matter-of-fact updates only, which aligned with their brand the most. HYPER shot up by 533% in the first week post launch, evidencing that merely posting playful / high energy posts isn’t indicative of community perception of the project’s token.
These examples show that the tone of posting should align with the product to really maximise the effect of the posts, albeit the underlying message is that projects should reflect their humanity - if the founding team is serious, the Twitter should be serious; if the founding team is more degen, the Twitter should reflect that.
Don’t save all announcements for after launch
Big news does not guarantee reach. Projects need to post when people are already paying attention, and they also need to maximise the content to feel hyped or exciting. An ideal way to announce updates is to mix bullish news with normal content. For instance, Kinto often used hype-driven posts but combined it with genuine product updates to show they were building—not just selling hype. That said, the $K token still fell 78% one week after TGE, but it was likely due to other reasons as the engagement itself was solid.
This pre-token launch engagement is key, as logical as that sounds, but not everyone does it. The engagement of some projects peaked pre-token launch when they were posting teasers or a chain of posts that led to the token launch.
Other projects didn’t leverage this obvious opportunity, even though the activity of the token launch in and of itself is normally enough of a reason for users to engage with content.
Engagement dies after launch
Don’t base your whole token launch campaign around airdrop-driven content. After the token launch week, engagement drops which is an evident reflection of users following the next big token launch and airdrop.
But projects can strategically make users stay with ongoing campaigns timed post-token launch to drive the engagement after the launch.
Quality over quantity
High posting volume doesn’t translate into high engagement. GoPlus, SonicSVM, and RedStone posted a lot, but didn’t really get high engagement relative to their user base and compared to incentivised posts (campaigns/token launch posts). Memes, generic call to action posts, or partnership announcements are not enough to sustain traction post-token launch unless there’s a real user interest behind the posts.
Call-to-Actions work, when used correctly
“Call to Action” posts, those that include links and explicitly ask users to do something work, but only when done correctly, accompanied by an extra incentive. Those projects that overdo the Call-to-Action-type posts didn’t really gain considerably more traction, but even turn out to sound annoying as every post seems to beg for users to do something.
Transparency is mission critical
Zora didn’t communicate the details around their tokenomics and airdrops on time, and ZORA dropped by 50% only 1 week after their TGE. Their posts during TGE week have good amount of replies, but the sentiment wasn’t really good, with lots of complaints and scam accusations
Technical Updates
Technical updates can drive credibility, but they must be packaged accessibly to attract engagement.
Quai Network, a unique blockchain with an innovative consensus model and an energy-backed token, focused heavily on explainers and technical threads. Their average views during TGE were ~24k impressions. QUAI rose 150% in the first week post-launch but fell 20% below listing price shortly after.
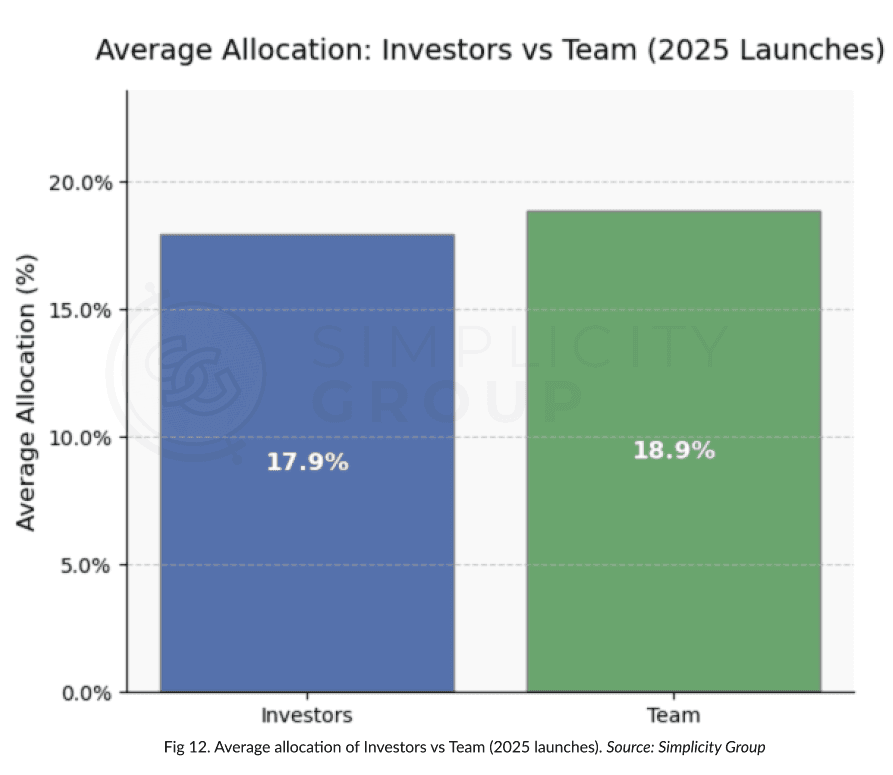
Average insider allocation split
Team allocations are slightly higher than investor allocations in 2025, averaging 18.9% vs 17.9% (Fig. 12).
It’s 2025 and most of the projects acclaimed for decentralization are still allocating almost 40% on average for insiders.
Launch Advice
Throughout the report, and notably in the previous few pages, we have outlined the results and their correlations with the success of price performances on and shortly after launch.
As mentioned in the introduction, it is impossible to determine causality, however, we are certainly able to take from the data a set of “principles” to follow, and we shall explain them here.
Focus on real engagement metrics.
It is evident that there is no correlation between likes, comments, reposts*, & impressions, and price performance before, during, & after token launch.
Thus, spending money on likes, followers, and engagement (be that through bots, quests, or airdrops) is arguably futile if the goal is to have a successful token launch and sustained price. It can definitely increase fundraising chances, exchange listing negotiations, partnerships with successful projects, and have other great benefits, but when comparing projects that had a lot to those who didn’t, there was no pattern to observe.
Focusing on real, purposeful content and growing organically will yield more results than seeing big numbers under each Tweet.
*Or, at least focus on getting reposts, because reposts before token launch had the strongest (but still weak) positive correlation to price performance.
Post real content for your community.
They like to see your product. They like to see announcements and progress. They like a real and consistent tone. What they don’t like is overzealous content, constant call-to-actions, and oceans of random posts and memes.
Each project’s Twitter profile is a crucial part of the brand image, and if it’s full of lacklustre and lazy content for the sake of content then it will easily translate into the project, and thus token, being low value too.
Also, don’t hold back optimistic announcements until after you launch, because engagement dies once the token is listed so you will be screaming into the abyss.
Initial circulating supply as a percent of total supply does not matter.
Whether you unlock 2% or 10% or 80% of your tokens on launch has no correlation whatsoever to price performance. What absolutely does matter, on a borderline perfectly linear relationship, is the dollar value.
There is an incredibly strong correlation, and it can be considered causation, between the IMC dollar value and the price, with a clear ~1.56% decrease in price performance for every 2.7x increase in IMC on a 1 month time frame.
This means that if you want to have a successful launch, you either need to have a low IMC by the way of a small initial circulating supply, or a low IMC by the way of a low Fully Diluted Valuation (FDV) with a high circulating supply (e.g. for a big airdrop).
This is one of the most crucial takeaways of this research because it highlights the criticality of not confusing a low initial circulating supply with a low initial market cap.
Fundraising more ≠ better price performance.
It is a common misconception that projects that raise a lot of money, especially from high tier investors, must be good, and by extension so must be their token. Alas, there is no correlation between token price performance and the amount of money raised.
This means that you don’t need to raise a lot of money to have a good token, and how much a project raised is not a good enough metric to consider for investment due diligence.
This is likely due to the fact that to raise more money a project needs to have higher valuations, and thus will have more sell pressure to sustain. But still the conclusion stands: raising more money does not mean you will have a better token, as the extra benefits of more cash do not, statistically speaking, outweigh the costs.
Dead usage is a dead price.
Volume is a great way to measure token health, as tokens with lower volumes also have much worse price performance, and vice versa.
Not causal, but clear correlation, and is thus a useful metric to keep in mind - you need to ensure your token economy has life.
Closing Remarks
By looking at the 50,000 data points we have identified clear patterns, or lack of them, in popular notions that people in the crypto industry swear by: social media engagement, initial market caps, volumes, fundraising amounts.
The importance of tracking the correct KPIs and not chasing vanity metrics cannot be overstated given the findings, and the value of supporting tokenomics is as statistically significant as causality itself.
Despite the limitations, it seems we have identified what successful projects do better than others, and it can be summarised in one line:
They do things for a reason, not because its what everyone else does.
As we aim to keep producing reports to uncover ultimate truths about this clouded industry, we hope this report contributes to the topic of successful token launches and the truths behind the things we hear.
Yours truly,
Simplicity Group
Endnotes
Sources
To ensure data integrity, all sources were used for both data acquisition and cross-verification throughout all 40 projects.
https://www.coingecko.com/
https://coinmarketcap.com/
https://cryptorank.io/
https://tokenomist.ai/
https://www.crunchbase.com/home
https://defillama.com/
https://x.com
Disclaimer
This document, along with the accompanying materials, has been produced by Simplicity Group - exclusively for informational purposes. It does not constitute financial advice, nor should it be construed as such. The content herein is intended solely to present observations from individuals who are not certified financial advisors. It is an effort to share perspectives and should not be perceived as professional financial guidance.
Furthermore, this document should not be considered a comprehensive resource for making investment decisions. It is not exhaustive and does not cover all potential risks or facets of investment opportunities. Investors are advised to conduct their own thorough research and assessment of all associated risks before making any investment decisions. This document is not intended to serve as the sole or primary basis for any investment strategy or decision-making process.
Additional Disclosures:
Regulatory Information: This material has not been reviewed by any regulatory authority. The provision of this document does not imply that it is compliant with all applicable laws and regulations, or that it has been tailored to adhere to the investment needs and objectives of any particular investor.
Changes and Updates: The information provided herein is based on the conditions and market scenarios at the time of this document's creation. Future changes in market conditions or new information could render this material outdated or inaccurate.
No Warranty: The information is provided "as is" without any guarantees, warranties, or representations, expressed or implied, of any kind. Simplicity Group and its affiliates disclaim any liability for any direct or consequential loss arising from the use of this document or its content.
Statement of Intent: None of the statements made within this document are intended to be discrediting, accusatory, or assumptive regarding any individuals, organizations, or technologies mentioned or discussed. The information is presented to inform and educate about the subject matter based on available data and research.
This report was created in good faith, with a steadfast commitment to unbiased representation and thorough research of the emerging technology discussed herein. It is designed to provide a balanced view. We disclose our research methodologies to ensure transparency and allow readers to understand how conclusions have been drawn.