Research Report

The Science Behind Tokenomics: How They Impact Launch Performance
Simplicity Group
·
Simplicity Group
·
Executive Summary
Analysing 40 token launches to understand the
relationship between price performance and the tokenomics of a project.
This article is a short summary of research delves into the intricate relationship between tokenomics and the price performance of newly launched tokens. By analyzing 40 major token launches from the first four months of 2025, we explore how specific tokenomic factors influence short- and medium-term price returns.
Our research focuses on four key hypotheses, uncovering actionable insights for founders and investors alike.
Community Allocation Matters
Projects allocating the highest percentage of tokens to their community (top tertile: 46.7%–63.0%) consistently delivered superior median returns: ~120% (1-week), ~350% (1-month), and ~200% (current).
Mid-range allocations (29.6%–46.7%) underperformed, suggesting a "go big or go home" approach is most effective.
Insider Allocations Show No Impact
No meaningful correlation was found between insider allocations (team + investors) and price performance, disproving the notion that higher insider shares inherently harm token value.
Transparency is Critical
One project was excluded due to unclear tokenomics documentation, highlighting the importance of transparent allocation and vesting schedules for investor confidence.
Lower Launch Prices Outperform
Tokens priced below $0.075 at launch significantly outperformed higher-priced counterparts across all timeframes (1-week, 1-month, and current).
Statistical tests (Kruskal-Wallis, Mann-Whitney U) confirmed this trend with high significance (p < 0.05), indicating a psychological advantage for lower-denomination tokens.
Ultimately, the data reveals the following key implications for founders.
Maximize Community Incentives: Allocate aggressively to community rewards to drive long-term engagement and price stability.
Set a Low Launch Price: Enhance perceived growth potential by pricing tokens below $0.075.
Avoid Over-Optimizing Unlocks: Focus on project fundamentals rather than micromanaging circulating supply dynamics.
This research underscores that tokenomics design, particularly community-centric distributions can significantly influence launch success. By grounding decisions in data, founders can mitigate risks and amplify growth opportunity.
Introduction
This report stands as a continuation of our latest analysis covering all of the token launches carried out in the first four months of 2025, in which we analysed how social media marketing strategies around a project’s token launch and valuation metrics like initial market cap (IMC) and initial circulating supply correlated with tokens’ price performance.
While this primary analysis helped us unlock valuable insights into the importance of social engagement before, during, and after launch, it also opened the door to more analysis opportunities to understand how the underlying tokenomics of a token might influence price performance.
At the time of crafting the overall conclusions of our previous report, new hypotheses centered around tokenomics started to emerge. For example, do projects that allocate more tokens to the insiders or the community, have more impact on price? And does a token’s initial listing price alter retail investors’ growth expectations?
Thus, we carried out research on these types of questions, in this report we dive deep into the following hypotheses:
Circulating Supply Change: Does the change in circulating supply after launch correlate with future returns?
Insider Allocation: Do higher insider allocations correlate with weaker price performance?
Community Allocation: Are greater community allocations a predictor of stronger price performance?
Listing Price: Do lower denomination prices influence performance?
By exploring these hypothesis, we aim to identify how token distributions actually have an impact on tokens’ price performance.
Our main goal is to leverage our database of 2025 token launches to generate data-driven insights for the design of stability-focused tokenomics, and to help investors recognise early signs of success in new token launches.
Methodology
Data Collection Process
Drawn from our previous report, we began by compiling a list of all token launches between January 1 and April 30, 2025. We applied three filters to identify the projects we would select. First, we included only projects with a minimum fully diluted valuation (FDV) of $10M at launch and time of the analysis. Second, we excluded memecoins and non-serious projects. Third, we required demonstrable traction through venture capital backing, strategic partnerships, or social engagement. Our original database comprised 40 projects to explore, but we excluded 1 from this report because its token distribution details lacked sufficient clarity.
For each of the 39 projects, we executed a data-collection strategy targeting tokenomics allocations and prices at different time frames. Overall, over 50,000 data points were gathered and over a 2,500 of them were used in this analysis.
Tokenomics
Tokenomics was prioritised. We documented token-allocation percentages across four distinct stakeholder groups: insider holdings for teams and investors, community distribution mechanisms like airdrops or rewards, treasury reserves for project development, and liquidity. Total and circulating supply, vesting schedules, token launch unlocks, cliff periods, and the vesting unlocks, were also tracked.
All tokenomics data underwent cross-verification between project documentation and analytics platforms including Cryptorank, CoinMarketCap, and Tokenomist.
Data Analysis and Visualisation Tools
To evaluate our hypotheses, we used Python (more specifically the Pandas, NumPy, Seaborn, and Statsmodels libraries) to process and analyse the data across all of the 39 analyzed token launches. We relied on the following set of exploratory and inferential tools and tests, as well as visual representations such as:
Visualization tools:
Scatter Plots: to visualize multiple variable relationships (such as insider or community allocations vs. price returns) and to inspect trendlines before formal testing
Box Plots: to compare the distribution of returns across allocation terciles or quartiles (like low/mid/high insider or community allocations), highlighting medians, interquartile ranges, and potential outliers.
Group Comparison Tests:
ANOVA: to test for differences in mean returns across allocation bins
Kruskal-Wallis H Test: this assesses whether the distribution of returns differs across bins.
Mann-Whitney U Test: pairwise post-hoc comparisons between bins when the Kruskal-Wallis test is significant, controlling for multiple comparisons when needed
Correlation Analysis:
Pearson’s r: to quantify linear correlation between continuous variables
Spearman’s p: to capture monotonic relationships that may not be strictly linear, providing a rank-based measure that is more resistant to outliers
Regression Modelling:
Ordinary least squares (OLS): to estimate the effect of each tokenomics variable on returns.
Robust Regression: such as Huber test, to mitigate the influence of extreme observations, ensuring coefficient estimates remain stable in the presence of outliers.
Tokens in the Analysis
Amnis Finance
Avalon Labs
Babylon
Berachain
CreatorBid
Bubblemaps
Bedrock
Bucket Procotol
Camino Network
Corn
Derive
DuckChain
Elixir
Mind Network
GoPlus
Gunzilla
Hyperlane
Story Protocol
Kinto
Kaito
Kernel
Keeta
Solayer
Nillion
Orbiter Finance
Particle Network
Plume Network
Powerloom
Quai Network
RedStone
MyShell
Solv
SonicSVM
SoSoValue
StakeStone
Walrus
WalletConnect
Xterio
Zora
Limitations
Limitations
This research, while rigorous in methodology, operates within constraints that may impact the interpretation of our findings. As with any analysis of market dynamics, several factors introduce inherent limitations to our conclusions:
Constrained Sample Scope
Our dataset encompasses 40 token launches meeting stringent selection criteria, such as the minimum $10M FDV and exclusion of memecoins. While this focused approach ensured the analysis of what we believe to be high-quality projects, the limited sample size reduces statistical power and increases susceptibility to outlier influence. We deliberately included projects across a spectrum of fundraising scales and engagement levels to enhance representativeness, however, the rapidly evolving nature of the 2025 launch landscape means these findings may not fully encapsulate broader market patterns or emergent tokenomics innovations outside our sampling window.
2. Linearity Assumption in Analytical Models
Our reliance on linear regression frameworks presupposes straightforward relationships between variables like insider allocation percentages and price returns. Cryptocurrency markets, however, frequently exhibit threshold effects and non-linear dynamics where small changes in one factor trigger disproportionate impacts beyond certain tipping points. For instance, the relationship between vesting schedules and sell pressure may follow logarithmic rather than linear patterns; our models cannot capture these complex interactions.
Exclusion of Macro Market Context
The analysis deliberately isolated project-specific factors without adjusting for broader market conditions during each token launch as it was too complex to quantify the weight of each exogenous factor on the correlation data. Total Market Cap changes, Bitcoin dominance shifts, sector-specific narratives (e.g. DeFi summer resurgence), or macroeconomic events like regulatory announcements significantly influence short-term returns irrespective of a project's fundamentals. A token launching during a market-wide liquidity surge might outperform despite weak fundamentals, while superior projects may underperform during bearish swings, albeit from January to April the market has been dropping in value.
Date of Research Collection
This research was conducted on projects that launched between January and April, yet is being published late June. In the last two months of writing this report, we have not seen any noticeable changes to the market that deviate from our findings, alas, it is worth noting that the crypto industry moves fast, so new patterns may be emerging that deviate from our analysis.
Missing Data
Some data was missing for projects, such as their fundraising amounts, or tokenomics. We conducted the analysis without the data for these projects, which may have skewed the results.
These limitations do not invalidate our findings but define their boundaries. We present them transparently to equip founders with the appropriate contextual lenses when applying these insights to launch strategy formulation.
Statistical Analysis
In this report we explored 4 separate hypotheses with our statistical analysis to understand how tokenomics impact your token launch:
Hypothesis 1: Circulating Supply Change vs. Price Performance.
Hypothesis 2: IDO Prices Vs. Returns: Do Lower Denomination Prices Influence Performance
Hypothesis 3: Community Allocation Vs. Price
Hypothesis 4: Insider Allocations Vs. Returns
Hypothesis 1: Circulating Supply Change vs. Price Performance
In this section, we analyse whether the change in circulating supply, calculated from the initial token unlocks to the present circulating supply, has any influence on price returns.
After calculating the percentage change for each of the token’s supply, first we performed a Pearson correlation test to assess if there’s any relationship between our variables: supply change and price performance.
As we can see in the scatter plot, the data is concentrated around the same area and there is no evident trendline between our variables. While we initially were expecting to see a wide range of token supply changes and to see how high unlocks to have lower price increases, in reality most tokens unlocked relatively little (<20 %), and the returns for most tokens stays below the 1,000% mark, with a single project (Keeta) reaching above 7,000% price increase
Most importantly, the Pearson and Spearman tests confirmed that there was no linear relationship between our variables, additionally, they’re not statistically significant with p-values higher than 0.2.

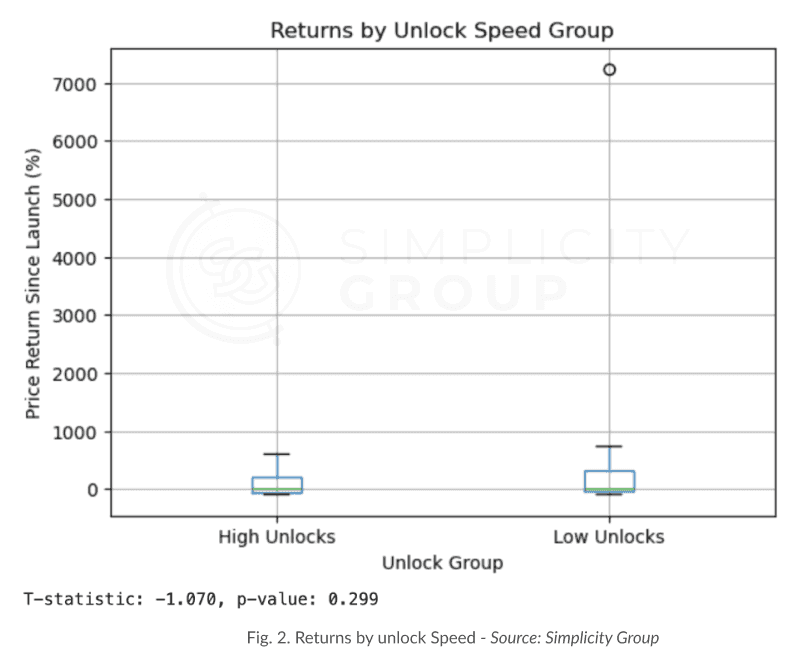
For these reasons, we tried a different approach consisting of separating the tokens with low and high unlocks to see if tokens that unlock more tokens (above the median) could systematically underperform.
We found that the difference between the two groups was not statistically significant. With a p-value of 0.299 being far above 0.05, there's no evidence that tokens with fast unlocks have different average returns than those with slow unlocks. Nevertheless, the presence of a single observation skews the whole boxplot.
To remove this extreme observation, we removed the extreme 5% tails of returns only to discover that visually, fast and slow token unlocks occupy very similar ranges of returns, despite the higher median for Fast Unlocks. However, the p = 0.731 confirms that this median difference is not statistically significant.
A crucial point here is that it seems slower unlocks median is below 0% whereas faster unlocks are around +40% in terms of price performance. This is only the case due to the Spearman test considering some data points as outliers in the second box plot, which put the median lower than it was in the original box plot. In reality, both plots, if merely zoomed in on the first one, are very similar.
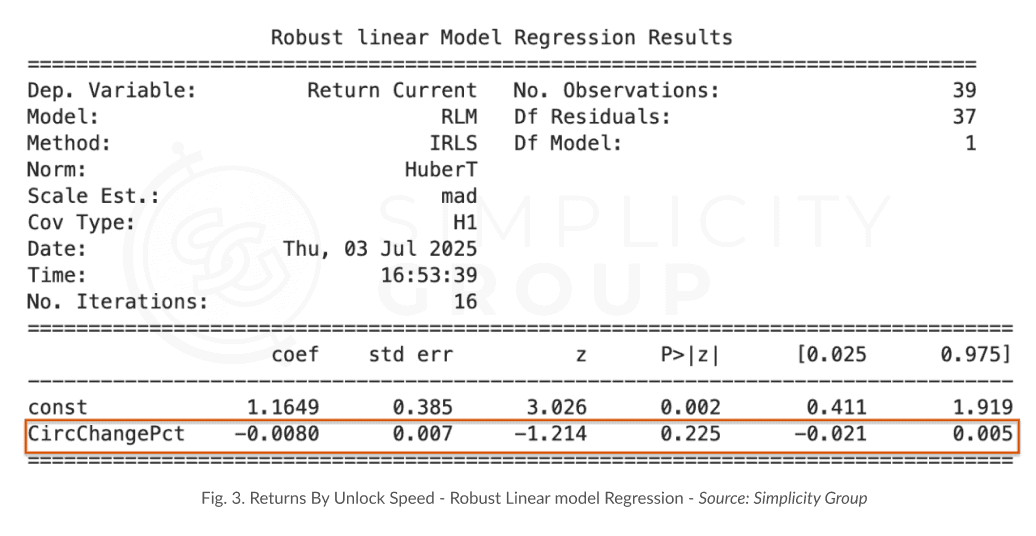
Even after treating outliers with Robust Regression which assigns different weights to data points based on their residuals (the difference between the observed and predicted values) to reduce their influence on the model, we discovered that overall, the model is still not statistically significant. After all these tests, we were able to rule out our initial hypothesis that the circulating supply change has any effect at all on medium-term price performance.
Hypothesis 2: Community Allocation Vs. Price
To prove the hypothesis of whether the total allocation for community has any effect on the price performance, we began by plotting every project’s community allocation on the x axis against their respective 1-Week, 1-Month, and Current Returns.
In each of these scatter plots, we also performed Pearson’s r and Spearman’s ρ, which respectively measure the strength of the linear relationship between the community tranches and returns (Pearson’s r), as well as the strength of said relationship on rank order (Spearman’s ρ).

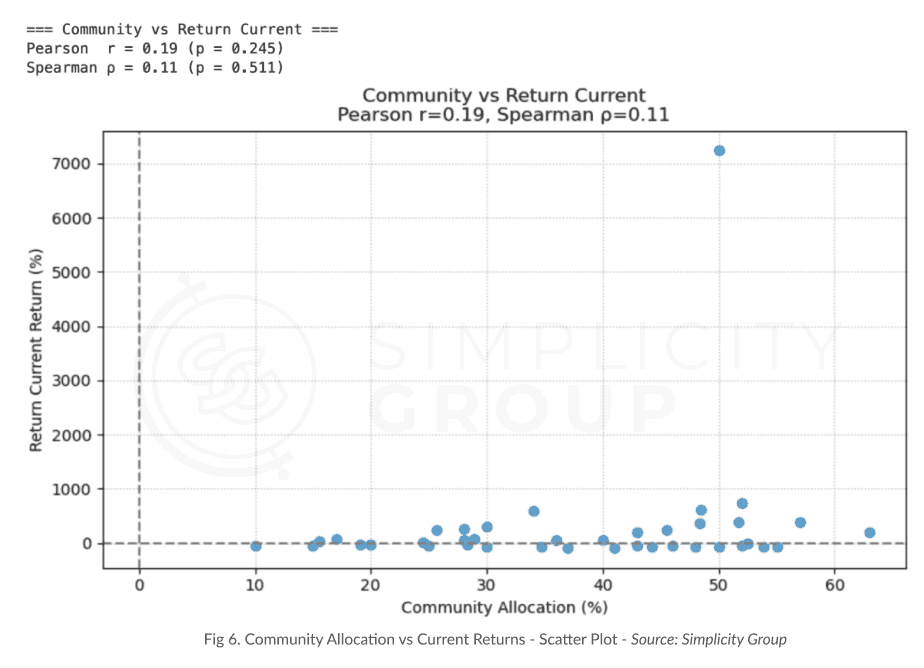
In the first scatter plots, we noticed that the points didn’t cover a specific trendline or form any pattern, and the correlations were not significant at all, which made us realize the “raw” observations in our database didn’t help us verify whether the community allocation by itself helped predict token performance to any level. Since we couldn’t find a statistical relationship between community allocation and price performance across various time frames, we proceeded to remove the outliers to investigate if any significant differences emerged.

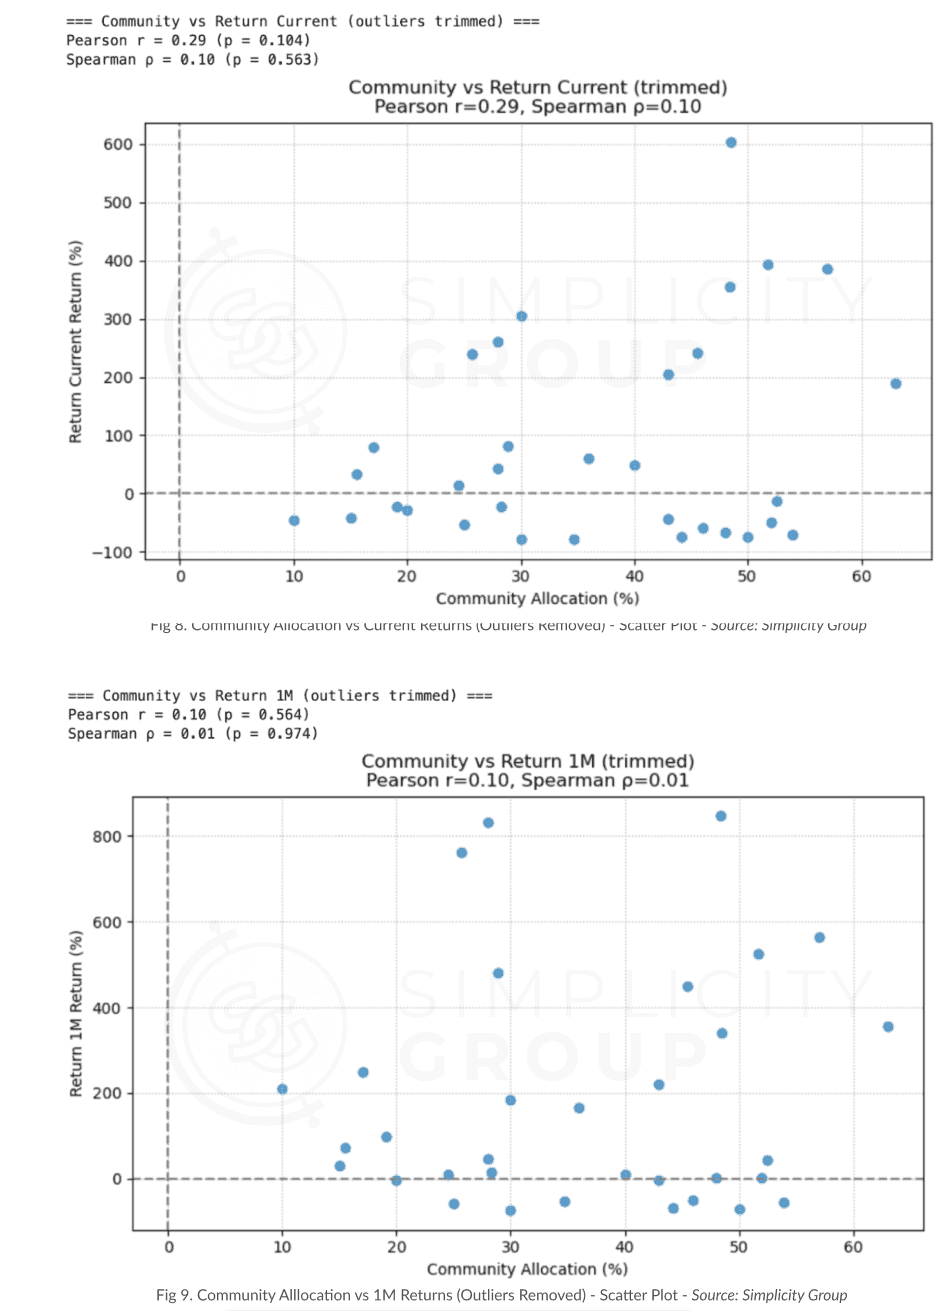
After treating the outliers by trimming out the top and bottom 1% of returns for all time frames, the statistics from our tests didn’t experience any significant changes. This meant that so far, the correlation between community allocation and price performance was non-existent.
To utilise a different approach, we decided to bin all the projects into three major categories (ranked by community allocation %) to see if any of these had a different impact on price performance.
Since we observed that the minimum community allocation in our database was 10% and the maximum was 63%, we split the 39 projects into three equal tertiles and generated boxplots and tests for each of the analyzed timeframes. The tertiles were balanced, each containing 13 projects:
Low: 10% - 29.6%
Mid: 29.6% - 46.7%
High: 46.7% - 63.0%
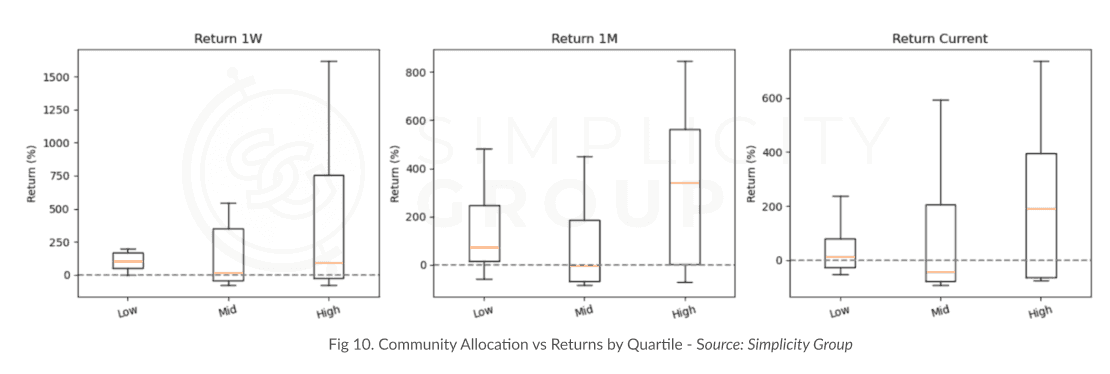
The results were more insightful with this approach compared to the analysis of the database as a whole.
The Low tertile, with lowest community allocations, showed more concentrated and modest gains.
The Mid tertile had the highest volatility and changed considerably from the 1-Week returns to the current returns, and overall showed pretty subpar results.
The High tertile consistently showed the highest median returns between all tiers on 2 of the timeframes. It showed medians of ~120% in 1-Week returns, ~350% in 1-Month returns, and ~200% in current-price returns.
Straight to the point, the conclusion for this part of the analysis is that, the higher community allocation, higher the average returns. This is proven by how the top-tertile projects deliver substantially better medians than both the low- and mid-tertiles.
Another insight is that the mid range tertile was very volatile and actually presented a lower median return than those projects which allocated less tokens for the community. With this, we can conclude that giving more tokens for the community seems to be a smart trade off as it can actually boost the expected token returns. However, it seems to be a “go big or go home” since the mid tertile underperformed the lower tier.
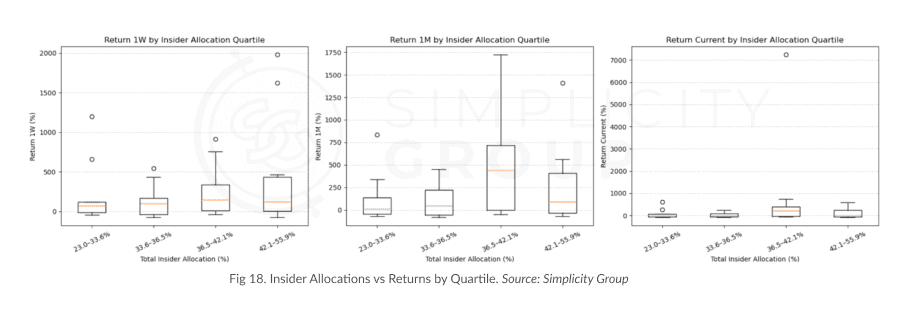
Hypothesis 3: Insider Allocations Vs. Returns
The hypothesis was simple: do projects with higher insider allocations (sum of investor and team tokens) experience any measurable different post-launch price returns? To test this, we began by simply plotting the total insider allocation from each project against each return timeframe and performing a Pearson correlation test.
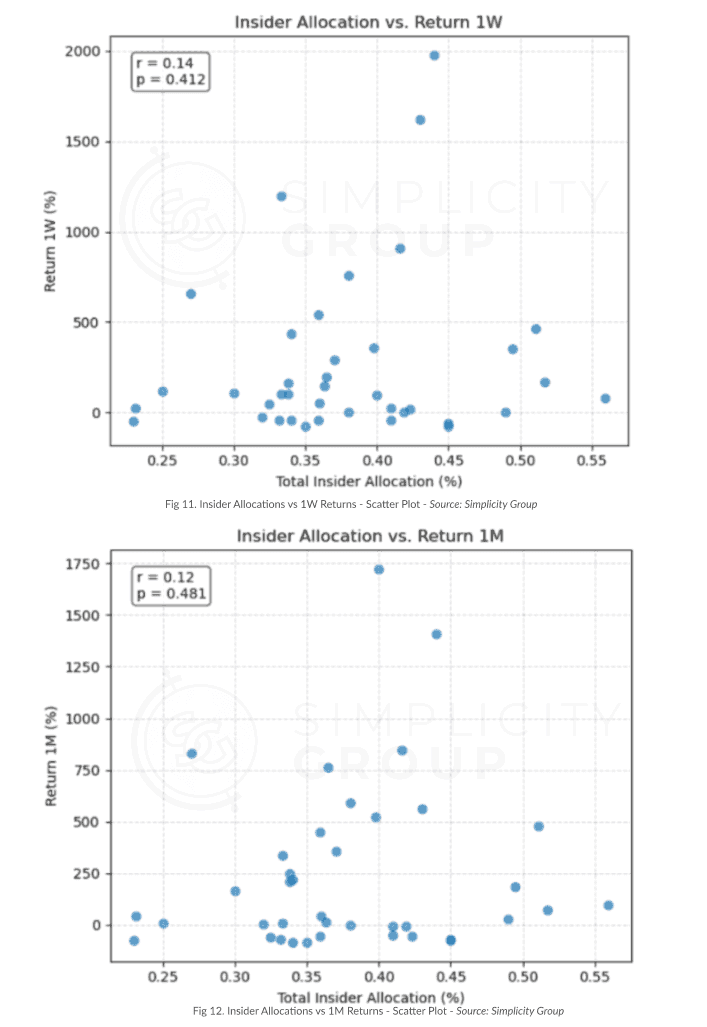
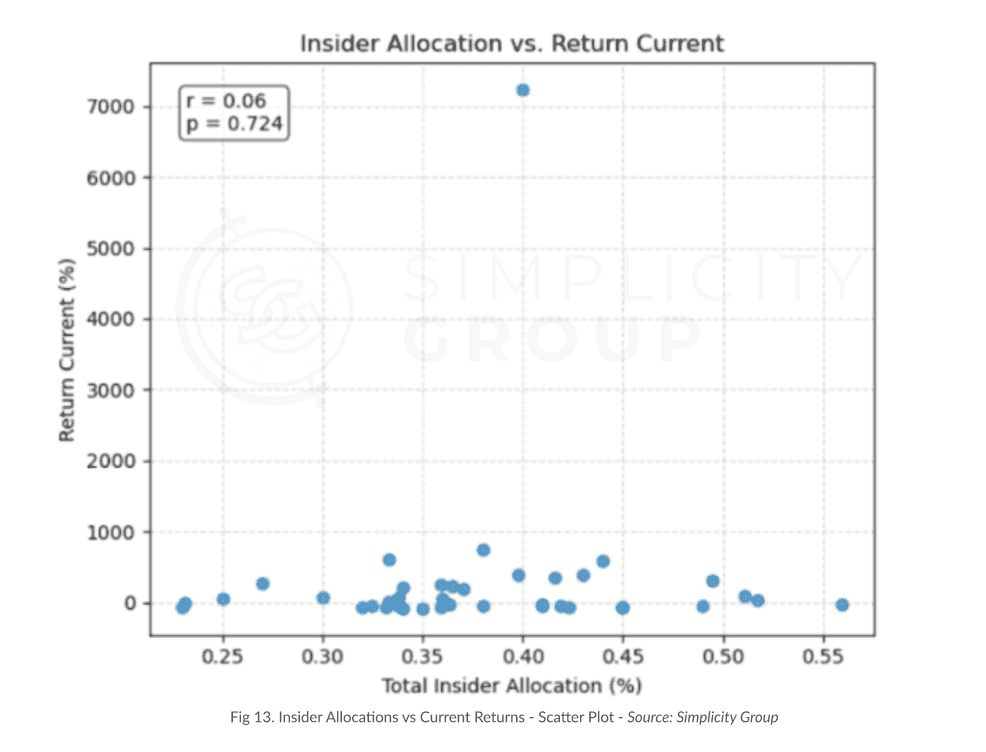
In the scatter plots above, we see how the project’s community allocations are scattered all across the place and there’s no clear upward or downward trend as insider allocation increases. Although the 1-week scatter plot shows a slight positive tilt with an r = 0.14 and p = 0.412, and the 1-month and current ones have similar weak coefficients of 0.12 and 0.06 but p values are extremely above 0.05, meaning that none of these correlations reach statistical significance anyways.

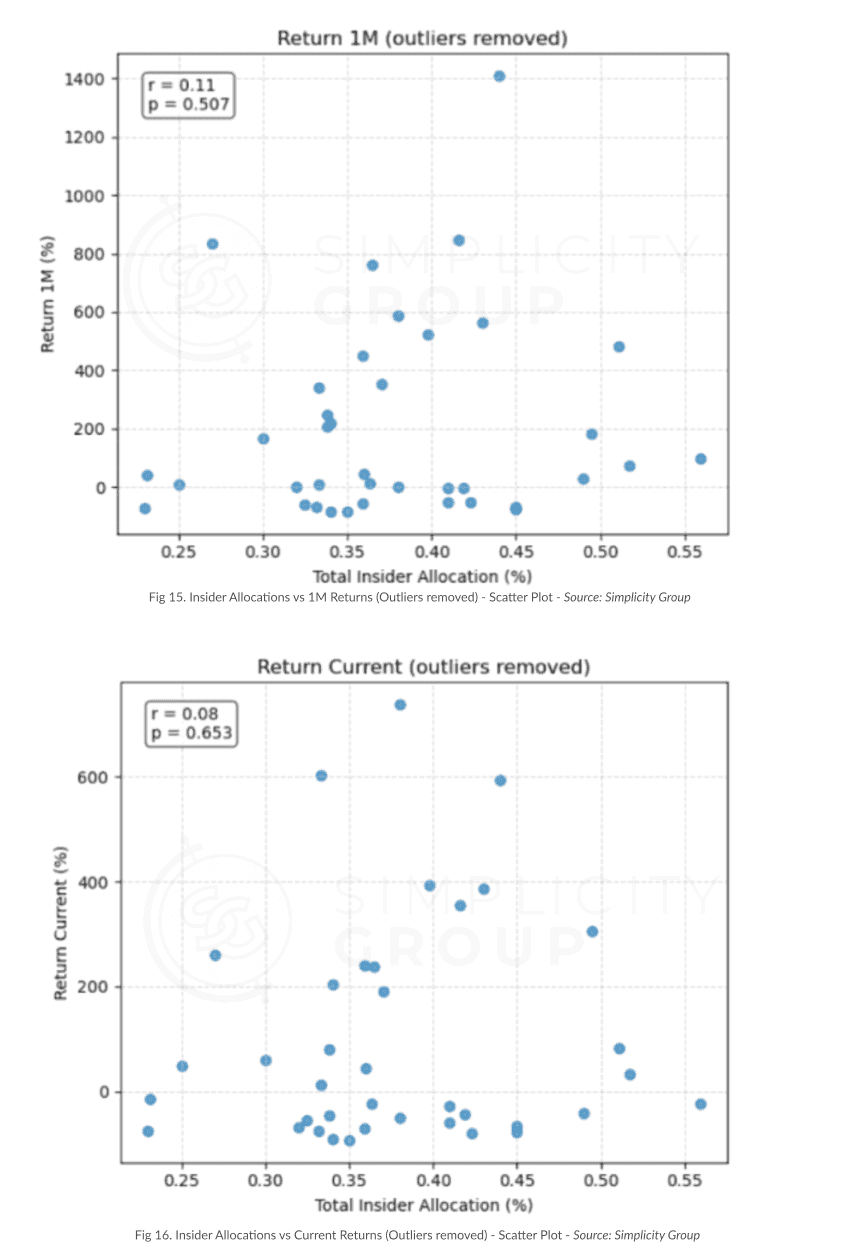
In the first iteration of scatter plots and tests we noticed a couple of outliers, so we re-ran the same tests removing any project whose insider allocations or returns were significantly away from the mean. The result was not different, the correlation coefficients remained similar to the previous test and these were not statistically significant either.
After trimming extreme outliers, all Pearson r’s were close to zero and p‐values well exceeded 0.05, confirming no statistically significant linear relationship between total insider allocation and token returns.
As a last step to rule out our hypothesis, we ran an ANOVA across the four insider allocation quartiles and for each return time frame. In every case, the p‐values were well above 0.05, showing the statistical insignificance. We also ran Kruskal-Wallis tests on the medians, and again, found no significant differences. This final check confirms that returns do not differ systematically across low, mid, or high insider‐allocation groups, effectively disproving our initial hypothesis that insider allocations influence price performance in any way.

To still capture any non‐linear effects, we next grouped projects (outliers included once again) into four quartiles by insider allocations and computed their average (and median) 1-Week, 1-Month, and current returns, mainly to have descriptive plots, even if they didn’t have strong statistical significance.
Looking at the boxplots side by side, we can see that projects with a medium insider allocation (about 36.5% - 42.1%) often have higher average returns and more spread, especially at the one-month and current checkpoints (due to outliers as well). But because all four groups overlap a lot and those higher averages in the middle group come mostly from just a few big outperformers, it’s clear that insider share by itself doesn’t reliably predict price performance. Not to mention that these boxplots were created merely as visual snapshots of our data given we had already ruled out our hypothesis.
Hypothesis 4: IDO Prices Vs. Returns: Do Lower Denomination Prices Influence Performance
We decided to shift our perspective away from the tokenomics themselves, and instead, focus on another greatly considered aspect of a token launch: token price. More specifically, we are trying to answer a lesser-known question about a token launch: does a lower token price lead to better performance due to the perception that a token has more space to run? It is common for founders to assume that a token price at $0.0005 has greater psychological growth potential than one at $5. To tackle this question, we first plotted all the token’s launch price against their Returns at 1-Week, 1-Month, and Current time frames. After visually analyzing the plot, we could see that there was no evident or linear relationship between the variables (no visually-identifiable pattern or trendline, at least).
However, we still suspected there could be a non-linear relationship between the variables, so we proceeded to split the launches into three price bands:
< $0.075
$0.075 - $0.5
> $0.5

What we found was interesting, the test showed that the lowest bucket ($0.01-$0.075) had a higher average 1-Week performance than tokens with higher prices. Nevertheless, while this test was statistically significant, we noticed that it was somewhat unbalanced because the bins didn’t contain the same number of observations:
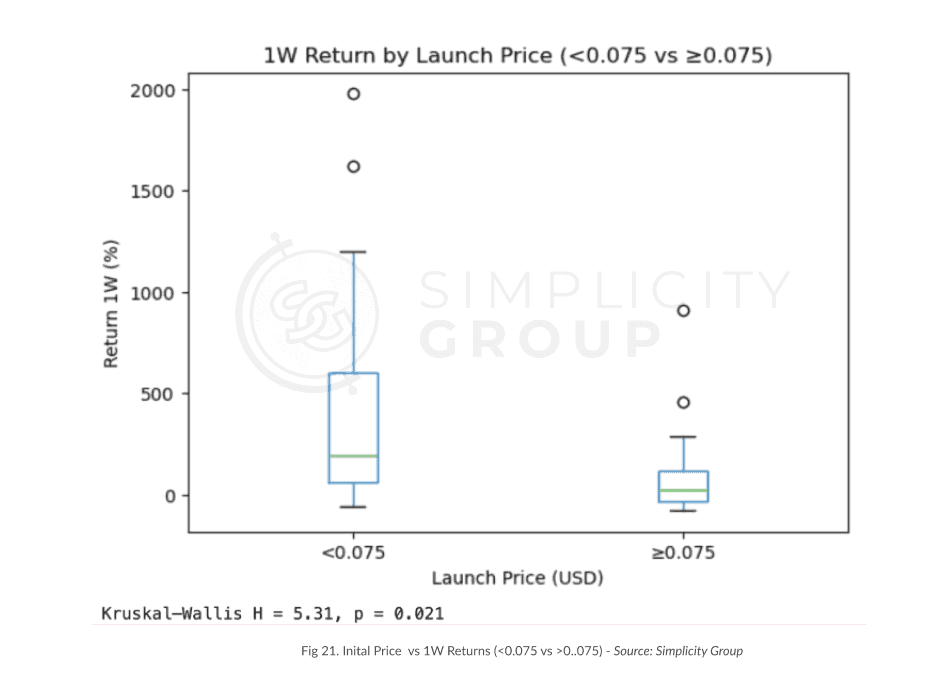
Due to this prominent uneven distribution, we redistributed the projects into only two bins with $0.075 as the middle point, leading us to a perfect distribution of observations in the two bins, with 19 projects in the lower than 0.075 bin, and 20 with a price equal or higher than 0.075.
With the box plot and Kruskal-Wallis test shown above, we verified that there is a real difference in 1-Week returns across the two price bins.
It allowed us to confirm that tokens launching below $0.075 obtained both a higher median gain and a more robust upper tail, meaning that there were more big winners. While it's likely a correlation and not direct causation, such a strong strong significance indicates that it may be a causal relationship.
While there are some observations identified as outliers in both groups, the Kruskal-Wallis results of H = 5.31 and p = 0.021 confirm that the difference in distributions is unlikely to be random.

After applying the same tests to the 1M and Current Returns, we saw that tokens that launched with a price below $0.075 showed a median return of above 200% and this price bin also generated more extreme outliers, meaning that overall, the lower launch prices outperform the higher-priced ones.
If we focus on the tests performed, both the Kruskal-Wallis and Mann-Whitney U tests verified our conclusions so far. These tests have been briefly explained in the methodology
section, but here’s what they help us understand:
The Kruskal-Wallis test compares distributions across groups. In this case, it showed that the collective return distributions of cheap vs. expensive launches differ more than we’d expect simply by chance.
With an H = 5.98 for the 1-Month period and statistical significance (p value of 0.015), the average return for the <$0.075 group is sufficiently higher than that of the ≥$0.075 group.
Regarding the returns at the current price, it had an even higher H of 7.2 and a lower p value (p=0.007), thus confirming that the returns for “cheaper” launches are also considerably better in the long run, and not only 1 month after the launch.
The Mann-Whitney U Statistic compares two groups’ rank distributions, or in simpler terms, it counts how many “wins” the low-price group has over the high-price group when comparing all returns. In this case, the test showed high U values which indicates a higher number of cases where the lower-priced group had higher returns against the higher-priced one.
For the 1-month returns, the test threw a U = 277 which in simple terms means that out of every possible “pairing” or rank between tokens of each group, the lower-priced group had the higher return 277 times, and with p = 0.015 to confirm that the returns are genuinely higher.
For returns at the current price, the U statistic was even higher (285) and the p-value much lower (0.008), therefore confirming that “cheap” tokens performed much better in the long run.
In simpler terms, the Kruskal Wallis and Mann-Whitney tests both confirmed that tokens launched at lower prices (<$0.075) consistently outperformed more expensive ones, in both short and long term post-TGE. The results were also not random, but solidified by clear statistical significance by high H and U values for the Kruskal-Wallis and Mann-Whitney tests, respectively.
Endnotes
Sources
To ensure data integrity, all sources were used for both data acquisition and cross-verification throughout all 40 projects.
https://www.coingecko.com/
https://coinmarketcap.com/
https://cryptorank.io/
https://tokenomist.ai/
https://www.crunchbase.com/home
https://defillama.com/
https://x.com
Disclaimer
This document, along with the accompanying materials, has been produced by Simplicity Group - exclusively for informational purposes. It does not constitute financial advice, nor should it be construed as such. The content herein is intended solely to present observations from individuals who are not certified financial advisors. It is an effort to share perspectives and should not be perceived as professional financial guidance.
Furthermore, this document should not be considered a comprehensive resource for making investment decisions. It is not exhaustive and does not cover all potential risks or facets of investment opportunities. Investors are advised to conduct their own thorough research and assessment of all associated risks before making any investment decisions. This document is not intended to serve as the sole or primary basis for any investment strategy or decision-making process.
Additional Disclosures:
Regulatory Information: This material has not been reviewed by any regulatory authority. The provision of this document does not imply that it is compliant with all applicable laws and regulations, or that it has been tailored to adhere to the investment needs and objectives of any particular investor.
Changes and Updates: The information provided herein is based on the conditions and market scenarios at the time of this document's creation. Future changes in market conditions or new information could render this material outdated or inaccurate.
No Warranty: The information is provided "as is" without any guarantees, warranties, or representations, expressed or implied, of any kind. Simplicity Group and its affiliates disclaim any liability for any direct or consequential loss arising from the use of this document or its content.
Statement of Intent: None of the statements made within this document are intended to be discrediting, accusatory, or assumptive regarding any individuals, organizations, or technologies mentioned or discussed. The information is presented to inform and educate about the subject matter based on available data and research.
This report was created in good faith, with a steadfast commitment to unbiased representation and thorough research of the emerging technology discussed herein. It is designed to provide a balanced view. We disclose our research methodologies to ensure transparency and allow readers to understand how conclusions have been drawn.
Read Time
Go To Market
Brief
Tokenomics design matters most when it shapes perceived accessibility and community ownership: high community allocations and low launch prices below $0.075 were associated with stronger returns. Insider allocation and post-launch circulating supply changes showed little measurable relationship to performance in this dataset.
Copy Link
Copied!
Share with founders, operators, and teams building in crypto.
Put this into practice
If this article raised questions about your own token or go-to-market plan, our team can help you work through them.


