Blog Post

Walkthrough Tokenomics Tool
Alex Fatuliaj
·
Co-Founder, Simplicity Group
·
We Built a Free Tokenomics Modelling Tool to Check Whether Your Token Valuation Is Reasonable
Most token valuations are guesses dressed up as targets. A founder picks a fully diluted valuation because a comparable project launched at a similar number, drops it into the pitch deck, and hopes the market agrees once the token lists. It rarely does, and the chart that follows tends to look the same across the market: a spike at launch, then a long bleed as unlocks hit a market with nowhere near enough demand to absorb them.
We kept having the same conversation with founders: is this token valuation reasonable, or are we about to price ourselves into a slow-motion dump? So we built a free tokenomics tool to answer it in a few minutes. It lives at tokenomics.simplicitygroup.xyz, and it is a quick sanity check on your token's launch valuation, not a replacement for a full model.
In short: the Simplicity tokenomics tool is a free, browser-based simulator that tests whether your token's launch valuation is realistic. You enter your supply, listing price, allocations and vesting, and expected demand, and it models your token price over up to 24 months using a constant product market maker, showing whether real demand can absorb the tokens unlocking onto the market. It is free, and it takes a few minutes.
What the tokenomics tool is, and why we built it
The tool is a free, browser-based tokenomics simulator. You enter your supply, your listing price, your allocations and vesting, and your expected demand, and it simulates what happens to your token price over the first 24 months using a constant product market maker (the same x*y=k mechanism that powers most on-chain liquidity).
A full modelling engagement takes weeks and answers dozens of questions; this answers one, fast: given the tokens hitting the market and the demand you genuinely expect, does your listing valuation survive the first two years, or does it fall apart the moment vesting kicks in?
In our modelling work, that mismatch between valuation and real demand is the most common reason a launch bleeds out after listing. A $100m FDV means very little if the only real demand is a few hundred thousand dollars a month and half your supply unlocks inside a year, and the tool makes that mismatch obvious before you commit it to a deck or a term sheet.
The four steps, and what each one reveals about your valuation
The tool walks through four steps, and each one adds a piece of the picture the simulation needs.
Step one: token and market setup. You start with the basics: project name, ticker, total supply (the maximum tokens that will ever exist), and your intended listing price. As you type the price, the tool works as a live fully diluted valuation calculator, so a $0.01 listing price on a one billion supply immediately reads as a $10m FDV (fully diluted valuation is simply your token price multiplied by your maximum supply). Watching that number move as you adjust the price is often the first sanity check.
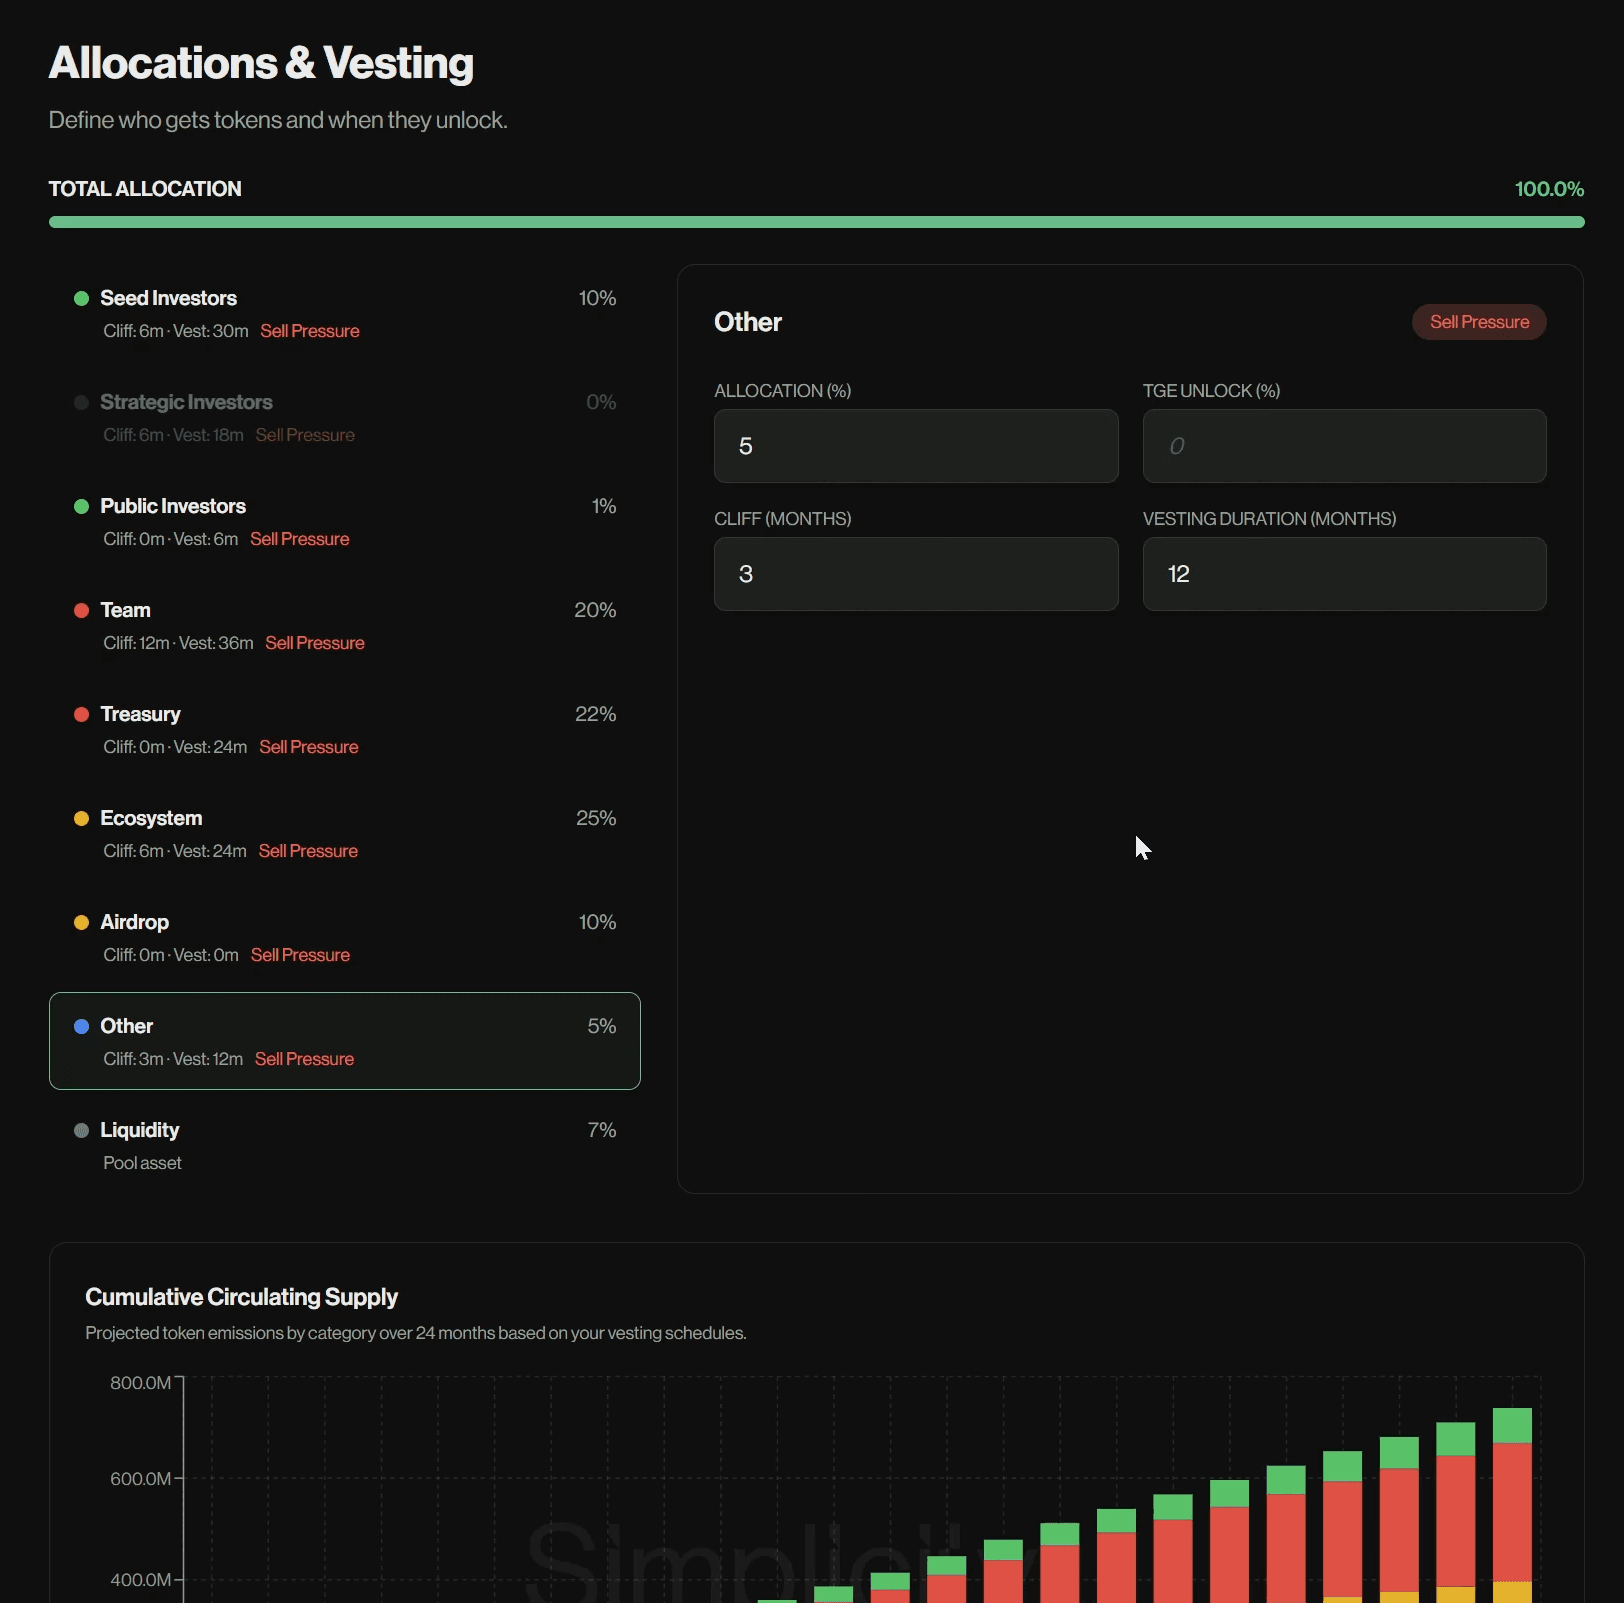
Step two: allocations and vesting. This is where you define who holds tokens and when those tokens come loose. You split supply across the standard buckets, seed, strategic and public investors, team, treasury, ecosystem, airdrop, liquidity, and anything else, and for each one you set the allocation percentage, the TGE unlock (the share released at the token generation event), the cliff in months (the delay before anything unlocks), and the vesting duration (how long the rest releases over). A running total keeps you honest at 100%, and each allocation carries a sell pressure indicator so you can see which buckets turn into supply on the market. A live chart plots your cumulative circulating supply by category across 24 months, which is the emissions schedule your price has to absorb.
Step three: buy pressure. Supply is only half the economy, so this page estimates the demand side. You set your launch buy pressure as a percentage of FDV (1%, 3% or 5%), then any buy pressure the team plans to inject in the first three months, and then the ongoing organic demand: how many token buyers you expect each month, their average spend, and your month-on-month user growth rate (the tool notes that this averages around 7.5%). It totals this into an initial monthly organic buy pressure figure, so you can see whether your demand assumptions are grounded or wishful.

Step four: results. Run the simulation, and the tool models your price against everything you entered.
What the results tell you about your valuation
The results page opens with the headline numbers: your listing price and implied FDV, the maximum drawdown in the pessimistic scenario (and the month it hits), and total buy pressure across the period. Underneath sits a Strategic Insight write-up that translates the charts into plain English, telling you the baseline and pessimistic drawdowns, when the worst point lands, and what to consider changing (usually lower TGE unlocks, longer cliffs, or more genuine utility). You can rerun the whole thing over 6, 12, 18 or 24 months.
Then come the charts, five of them, each answering a different question.
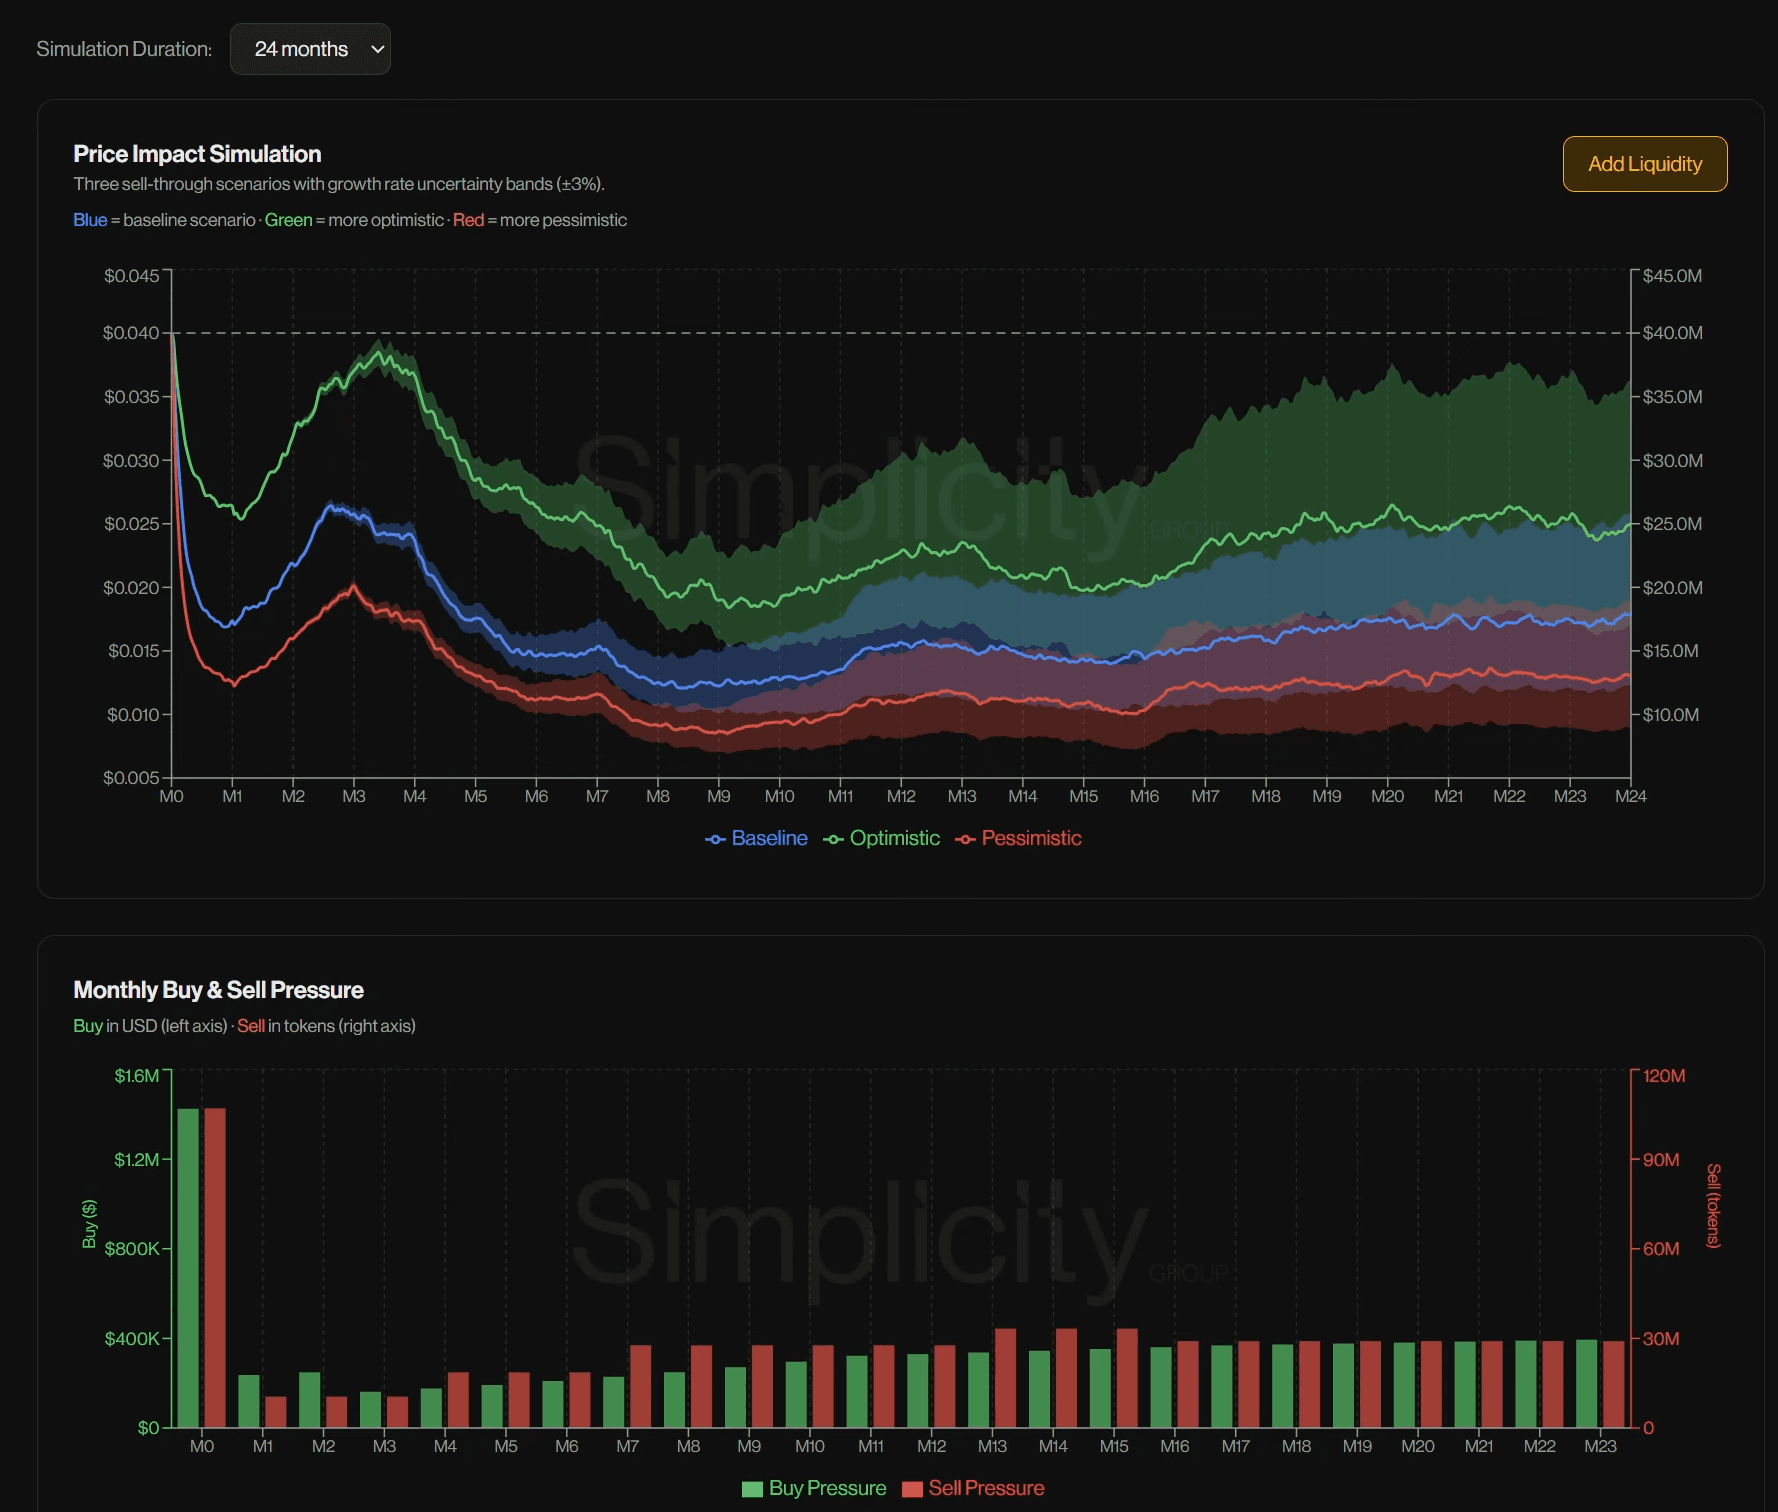
Price impact simulation. This is the headline chart. It plots your token price across the period under three scenarios, baseline, optimistic and pessimistic, so you see a range of outcomes rather than a single fragile line.
Monthly buy and sell pressure. Buy pressure in dollars against sell pressure in tokens, month by month. When the sell side overtakes the buy side, you are looking at the months where supply swamps demand.
Necessary buy pressure to sustain price. The dollars of demand required each month to fully absorb the tokens unlocking at your listing price. It is a number few founders ever calculate before launch, and it is usually uncomfortable when they do.
Team token sale revenue. What the team and ecosystem tranches would raise, monthly and cumulatively, if they sold their unlocks at the baseline simulated price. It helps with treasury planning, and it tends to deflate any assumption that those tokens are worth their paper value.
Cumulative circulating supply. Your emissions stacked by category over time, the supply side of the whole picture in one view.
The core simulation is free and open; signing in with Google unlocks the fuller version, including the complete price-impact charts, the unlock schedule, and liquidity tooling. Taken together, they tell you whether your valuation is a number the market can hold up or one that only exists in the deck.
How the tokenomics simulator works
The engine sits on a constant product market maker. Price is a function of the ratio of assets in the pool, so every token that gets sold moves the price down the curve, and every dollar of buy pressure moves it back up. It is a simplification of real market structure, but it captures the core mechanic: thin demand against heavy unlocks pushes price down, and the size of that move depends on how much sits in the pool.
To avoid pretending the future is knowable, the tool runs three paths. It takes the buy pressure you entered as the baseline, then runs an optimistic scenario at 150% of that demand and a pessimistic scenario at 50%. Around each of those three runs it draws a growth rate uncertainty band of plus or minus 3%, so what you see is a spread of what could plausibly happen if demand runs a little hotter or colder than each scenario assumes, rather than a single clean line.
That spread is the point. A valuation that only works in the optimistic run is a valuation that needs everything to go right (it rarely all does).
One caveat we put on every model, including this one: do not read the exact prices. A model cannot tell you whether your token is $4.36 or $7.43 in month three, because a single tweet or a shift in the macro can erase any precise number. What it tells you is direction and magnitude, the difference between one set of choices and another, which is the part you can act on. If you want the longer version of how we think about valuing tokens, we wrote it up separately in How To Correctly Value Tokens.
Where the tool stops and a full tokenomics model begins
The tool is deliberately narrow. It answers the valuation question well and quickly, and it stops there. A full tokenomics modelling engagement is a different exercise.
When we model an economy properly, we build the whole thing out, every actor and every moving part, rather than price against unlocks alone. That means the liquidity pools, the staking contracts, the lending markets, the treasury, and the relationships between all of them encoded so an output can feed back into an input the way it does in a live system. Token price affects the number of buyers, which affects the price again, a feedback loop the free tool cannot capture.
It also means designing the parts the tool takes as given. Utility and economic policy, how the token captures value, what staking rewards should be and where they come from, how fees route, how emissions respond to conditions rather than following a fixed schedule. Those are design decisions, and they are where most of the value in an economy is won or lost.
The outputs go far wider too. Instead of price and supply, a full model gives you staking participation and APY over time, protocol fees, TVL, treasury runway, and holder distribution, and it shows how each of those behaves under stress. We build these in Machinations and run them hundreds of times to find the averages and, more importantly, the edge cases: the one run in 250 where six months of weak demand tips the protocol into a death spiral. (We wrote more on why serious projects model their economy separately.)
And we test properly. Rather than three preset scenarios, we run sensitivity analysis on the individual inputs and assumptions that matter, changing one lever at a time to see what your economy is genuinely fragile to. Move staking APY from 6% to 12% and watch what happens to liquidity, lending pools and sell pressure. The free tool opens that door; the full engagement is the work on the other side of it.
If you want the full picture
Simplicity Group has worked with 200+ projects, contributed to over $2.5bn in market cap, and helped teams raise more than $160m. Both co-founders hold MSc Economics degrees from the University of Leeds, and we mentor at the Solana Foundation, Techstars Web3, Cointelegraph Accelerator and Outlier Ventures. Tokenomics modelling is most of what we do.
So use the tool. Run your numbers, and if the pessimistic line looks like most crypto charts, take that as the cheap warning it is. If it raises questions you would rather answer before your token is live and every holder is watching, that is when it is worth talking to us. You can find the tool at tokenomics.simplicitygroup.xyz, and the rest of what we do at simplicitygroup.xyz/tokenomics.
Better to find out your valuation is fiction now, while it costs you nothing but a few minutes and some honesty about your demand assumptions.
Frequently asked questions
What is the Simplicity tokenomics tool?
The Simplicity tokenomics tool is a free, browser-based simulator at tokenomics.simplicitygroup.xyz. You give it your token supply, listing price, allocations, vesting and expected demand, and it models your token price over up to 24 months to show whether your launch valuation is realistic.
Is the tokenomics tool free?
Yes, the simulator is free to use. The core run is open, and signing in with Google unlocks the fuller version of the charts and tooling. A bespoke tokenomics modelling engagement with our team is a separate paid service.
Is my tokenomics data private?
The core simulation is open and needs no account. Signing in with Google, which unlocks the extended view, captures your email address so we can follow up, and that email is the only thing we take from you.
What do I need to use the tokenomics tool?
Four things: your total supply and intended listing price, your allocation and vesting schedule, and a rough estimate of your monthly demand (buyers and average spend). It takes a few minutes, and you can run it before your tokenomics are finalised.
How do I know if my token valuation is reasonable?
Compare the tokens unlocking onto the market against the demand you can realistically generate to absorb them. If the buy pressure needed to hold your listing price sits far above your genuine monthly demand, your valuation is too high. The Simplicity tokenomics tool calculates both sides and shows you the gap.
What is a constant product market maker?
A constant product market maker is the pricing mechanism (x * y = k) behind older DEX liquidity pools. Price is set by the ratio of the two assets in the pool, so selling pushes the price down and buying pushes it up, with the size of each move depending on how deep the pool is. The Simplicity tokenomics tool uses this model to simulate price impact. It is outdated, but modelling Concentrated Liquidity MMs wouldn’t make much difference in determining whether the valuation is reasonable, but it would make the tool way more complex.
How is the free tool different from a full tokenomics model?
The free tool answers one question, whether your valuation holds up, using price, supply and demand. A full Simplicity engagement builds your entire economy, designs the utility and economic policy, and models staking, fees, TVL, treasury flows, revenue, and everything else, with far heavier testing of your individual assumptions.
How accurate is the tokenomics simulator?
The Simplicity tokenomics simulator is directionally useful rather than a price oracle. If your demand assumptions are wishful, the output will be too, so use it as a high level sanity checker, not to predict an exact future price.

Co-Founder of Simplicity Group. BA Economics and Politics. Specialist behavioural economist; writes and mentors about tokenomics, game theory, and growth.
Category
Tokenomics
Read Time
Tokenomics
Brief
A free tokenomics tool that simulates your token price over 24 months
Copy Link
Copied!
Share with founders, operators, and teams building in crypto.
Put this into practice
If this article raised questions about your own token or go-to-market plan, our team can help you work through them.